Construction Financial Model in Excel (Free Contractor Download)
A construction financial model projects contract revenue and maintenance income against direct costs near 70% of revenue, equipment CAPEX, project debt and working-capital swings, producing linked statements with DCF and IRR. Generate a 16-sheet Excel model free for up to 3 years.
⚡ Generate my Construction model — free (requires JavaScript)
The fastest way to an investor-ready construction financial model is a template pre-loaded with the industry's real revenue drivers and cost structure. This generator builds a 16-sheet, fully formula-linked Excel workbook — three statements, DCF & IRR — around construction-specific assumptions in about five minutes. Free up to 3 years, just your email.
Key drivers pre-loaded in this template
| Contract revenue | Project pipeline × average value |
| Maintenance contracts | Recurring post-completion income |
| Direct costs ~70% | Materials and subcontractor heavy |
| Working capital days | Retention and milestone-billing cycle |
What you get
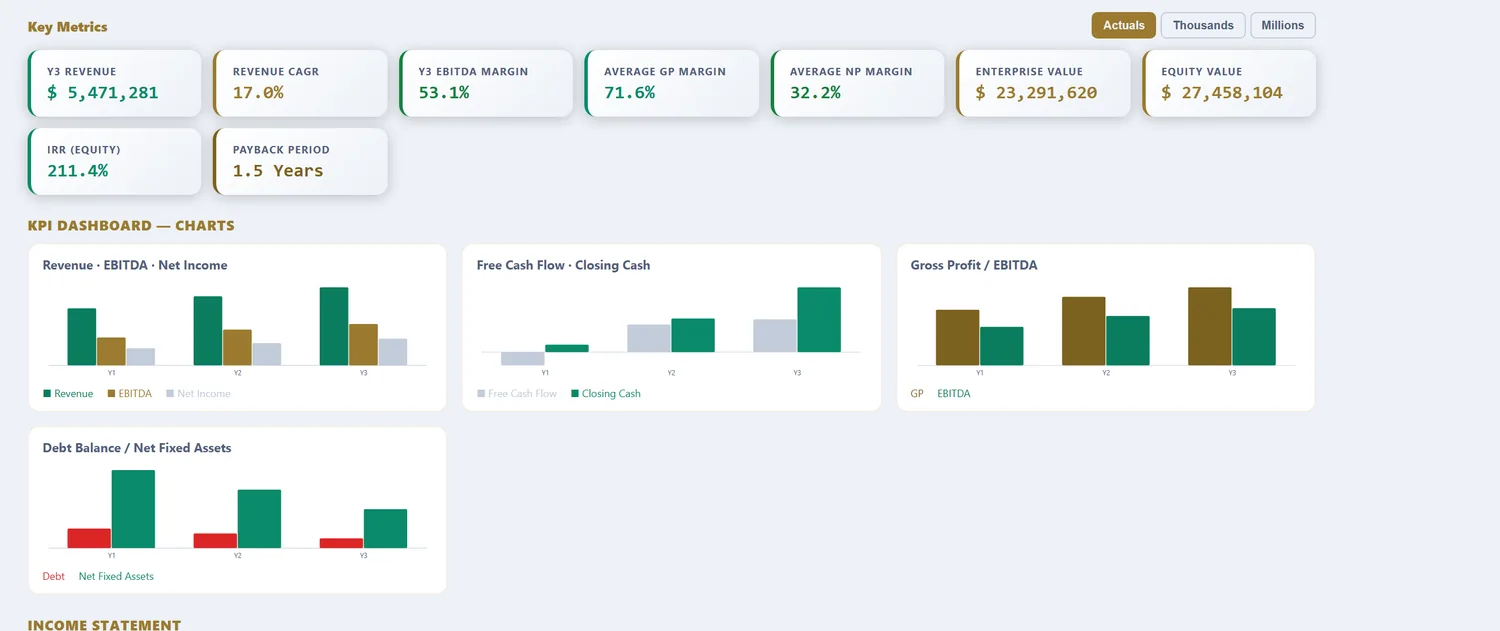
A 16-sheet, fully formula-linked Excel workbook: Assumptions, Revenue, OPEX, CAPEX & Depreciation, Debt, Tax (with loss carryforward), Income Statement, Cash Flow, Balance Sheet, DCF Valuation, Sensitivity tables, a charted KPI Dashboard, a Scenarios sheet (Base, Best & Worst), and an Integrity Check. Free 16-sheet linked Excel download for models up to 3 years (annual or quarterly, just your email). Models from 5 to 25 years are $29.98 per model download.
What a construction financial model computes
Contracting is a thin-margin, cash-timing business where the profit is rarely the problem and the cash usually is. Revenue is recognised by percentage of completion, so it follows the work rather than the invoice, and margins over direct costs of 70-85% leave only 10-20% of gross before overhead. The two forces that decide whether a contractor survives are backlog, the signed work ahead of it, and the cash cycle, the gap between paying for work and collecting for it, widened by retention held back until completion. A generic template models neither, treating construction as a normal revenue business and missing exactly the mechanics that sink contractors.
The template loads contractor-scale defaults: contract revenue recognised over the build, direct costs near 75%, retention on progress billing, and the working-capital swing that comes with it. What follows is what each part does with real construction numbers in it.
Contract types change the risk
Before any numbers, the contract structure sets who carries the risk of an overrun, which changes the whole model.
| Contract | Who bears overrun | Margin | Modelling focus |
|---|---|---|---|
| Fixed-price / lump-sum | The contractor | Higher if delivered on budget | Cost control, contingency |
| Cost-plus | The client | Lower, but protected | Fee %, cost pass-through |
| Unit-price | Shared by measured quantity | Middle | Quantities, rates |
| Design-build | The contractor (broad) | Variable | Scope, risk transfer |
Fixed-price contracts hand the overrun risk to the contractor, so the margin is higher when the job comes in on budget and evaporates when it does not, which is why a contingency line belongs in every fixed-price estimate. Cost-plus reverses that: the client absorbs overruns and the contractor earns a protected fee, lower but safer. Unit-price splits the difference by measured quantity. The model keeps the contract type explicit because the same job carries very different risk depending on who pays when it runs long.
Backlog and the cash cycle
Two numbers tell you more about a contractor than its profit: backlog and the cash cycle.
| Metric | Definition | What it reveals |
|---|---|---|
| Backlog | Signed work not yet built | Revenue visibility ahead |
| Book-to-bill | New awards ÷ revenue | Whether the pipeline is growing |
| Gross margin | Contract value − direct cost | Thin, 10-20% typical |
| Retention held | Cumulative withheld cash | The persistent cash drag |
Backlog is the visibility a contractor has into future revenue, and a shrinking backlog is an early warning long before it shows in the profit and loss. Book-to-bill says whether the pipeline is filling faster than it empties. Margin is thin and unforgiving. And retention held is the cash the contractor has earned but cannot touch, accumulating across every job until sign-off. The model tracks all four so the business can be read the way a surety or a lender reads it.
The four assumptions that decide construction returns
| Assumption | Typical range | Why it dominates |
|---|---|---|
| Gross margin | 10-20% | Thin, so small overruns hurt |
| Retention % | 5-10% of billing | Sets the working-capital drag |
| Cost overrun / contingency | + 3-8% buffer | Comes straight off fixed-price margin |
| Backlog / award growth | Varies | Drives future revenue and cash |
Margin is thin, so a modest overrun can wipe out a job's profit, which is why cost control and a contingency are the difference between a good year and a claim. Retention sets how much earned cash stays locked up. Overruns come straight off the fixed-price margin. And backlog growth drives both future revenue and the working capital that future revenue will demand. The model runs all four so a growth plan is judged on the cash it consumes, not just the revenue it books.
Worked example: a mid-size contractor, in numbers
| Input | Value |
|---|---|
| Annual contract revenue | $40M |
| Direct costs | 76% of revenue |
| Gross margin | 24% before overhead |
| Overhead | 14% of revenue |
| Operating margin | ~7-10% |
| Retention withheld | 7% of billing |
| Payment lag | 45-60 days |
| Backlog | ~1.5x annual revenue |
From contract to margin and cash
$40M of recognised revenue at a 24% gross margin is about $9.6M of gross profit, and after roughly 14% of overhead the operating margin lands near 7-10%, normal for a contractor and unforgiving of error. The profit is only half the story. With 7% retention on billing and a 45 to 60 day payment lag, a large slice of the year's cash is tied up in retention and receivables at any moment, and growth widens the gap: a contractor scaling revenue 30% has to fund 30% more work in progress and retention before the extra cash arrives. That is why the model tracks billing against cost period by period and surfaces the funding need, and why a surety underwrites the balance sheet as hard as the profit. Over a 3 to 25-year horizon the DCF and IRR follow, but for construction the peak funding need is often the number that decides whether the plan is fundable at all.
Change orders and the claims that decide the margin
On many jobs the difference between profit and loss is not in the original contract at all, it is in the changes. A change order alters the scope after the contract is signed, and how it is priced and approved decides whether extra work is paid for or absorbed. Approved change orders add revenue and usually margin; disputed ones become claims that tie up cash and management time and may never be collected. A fixed-price job that runs into unforeseen ground conditions or a client-driven redesign can see its margin swing entirely on how those changes are handled. The model treats change orders as their own revenue and cost stream rather than folding them into the base contract, so approved variations lift the forecast and unresolved claims sit visibly as at-risk receivables. Contractors who track this well protect thin margins; those who assume every change gets paid discover the shortfall at final account, long after the cash is spent. On a $40M job at a 24% margin, a single disputed $1M variation left uncollected wipes out a tenth of the gross profit and drags on cash for months while it is argued, which is why the model carries change orders and claims as their own line rather than trusting them to the base contract.
Construction model vs a generic financial model
| What differs | Generic model | Construction financial model |
|---|---|---|
| Revenue timing | On sale / delivery | Percentage of completion |
| Cash vs revenue | Assumed equal | Retention and lag split them apart |
| Margin | Comfortable | Thin, 10-20%, overrun-sensitive |
| Visibility | Forecast growth | Backlog and book-to-bill |
| Key risk | Profit | Peak funding need and cash timing |
Sector activity and pipeline for grounding backlog and growth assumptions are published monthly by the US Census Bureau in the Construction Spending release, the standard reference for construction put in place.
Reference: US Census Bureau — Construction Spending, the benchmark series for construction put in place.
How to download your construction model (3 steps)
- Choose the Construction template. The contract revenue, direct-cost, retention and billing defaults load as editable inputs.
- Set your own contract value, margin, retention, payment lag and backlog assumptions. Pick annual or quarterly periods and a 3 to 25-year horizon.
- Preview the linked statements, margin, cash and IRR, then download the Excel workbook. Up to 3 years is free with just your email; longer horizons are a one-time purchase.
Three focused variants build on the same construction engine: the construction cash flow forecasting model for retention and progress billing, the construction DCF valuation model for enterprise value and IRR, and the construction free cash flow model for the peak funding need.
Frequently asked questions
How do I reflect milestone billing?
Adjust working-capital days to capture the lag between cost incurrence and client payment, including retentions.
Can I model equipment purchases?
Yes — primary and secondary CAPEX lines with separate useful lives and depreciation.
What horizon do infrastructure projects need?
Contractors plan 3–5 years (free); concession and BOT projects are appraised over 15–25 years with premium.
How is construction revenue recognised?
Most contractors use the percentage-of-completion method: revenue is booked as the job progresses, measured by costs incurred against total estimated costs. A job 40% through its budget recognises 40% of its contract value and margin. This ties revenue to work done rather than to cash received, which is why a contractor's billing and its revenue rarely match in any given period, and why over- and under-billing have to be tracked.
What is retention (retainage) and how does it hit cash?
Retention is the portion of each progress payment, commonly 5-10%, that the customer withholds until the job is complete and signed off. It protects the client but starves the contractor of cash on work already done, and it is only released at the end, sometimes months later. Because it accumulates across every active job, retention is one of the largest and most persistent calls on a contractor's working capital.
Why do profitable contractors go bust?
Cash timing, almost always. A contractor pays for materials, subcontractors and labour as the work happens, but collects on a lag, with retention held back on top. Growth makes it worse: more and bigger jobs mean more cash tied up before payment, so a contractor can be profitable on paper and insolvent in practice. The model tracks billing against cost so the funding gap is visible before it closes the business.
Construction across our four models
Construction Cashflow Forecasting Model · Construction DCF Valuation Model · Construction Free Cashflow Model
More industry financial models
SaaS / Subscription financial model · Data Center financial model · Real Estate financial model · Manufacturing financial model · Hotel / Hospitality financial model · E-commerce / Retail financial model · Healthcare / Clinic financial model · Fintech / Lending financial model · Energy / Solar financial model · Early-Stage Startup financial model · Restaurant / F&B financial model · Professional Services financial model · Logistics / Transport financial model · Education / Training financial model · Media / Content financial model · Telecom / ISP financial model · Agriculture financial model · Pharma / Distribution financial model · Fitness / Wellness financial model · Nonprofit / NGO financial model · Pricing
Free tools
WACC calculator · CAPM calculator · DCF calculator · IRR calculator · Inside the 16-sheet model · Glossary