Pharma Financial Model in Excel (Free Distribution & Margin Download)
A pharmaceutical distribution financial model projects drug and medical-supply revenue (units × price) against thin distribution margins (~68% COGS) and a 60-day working-capital cycle, producing linked statements with cash-flow visibility and valuation. Generate the full 16-sheet Excel model free for up to 3 years.
⚡ Generate my Pharma / Distribution model — free (requires JavaScript)
The fastest way to an investor-ready pharma / distribution financial model is a template pre-loaded with the industry's real revenue drivers and cost structure. This generator builds a 16-sheet, fully formula-linked Excel workbook — three statements, DCF & IRR — around pharma / distribution-specific assumptions in about five minutes. Free up to 3 years, just your email.
Key drivers pre-loaded in this template
| Units × price | Volume-driven distribution revenue |
| Medical supplies stream | Adjacent product income |
| COGS ~68% | Thin-margin wholesale economics |
| Working capital 60 days | Inventory- and receivables-heavy cycle |
What you get
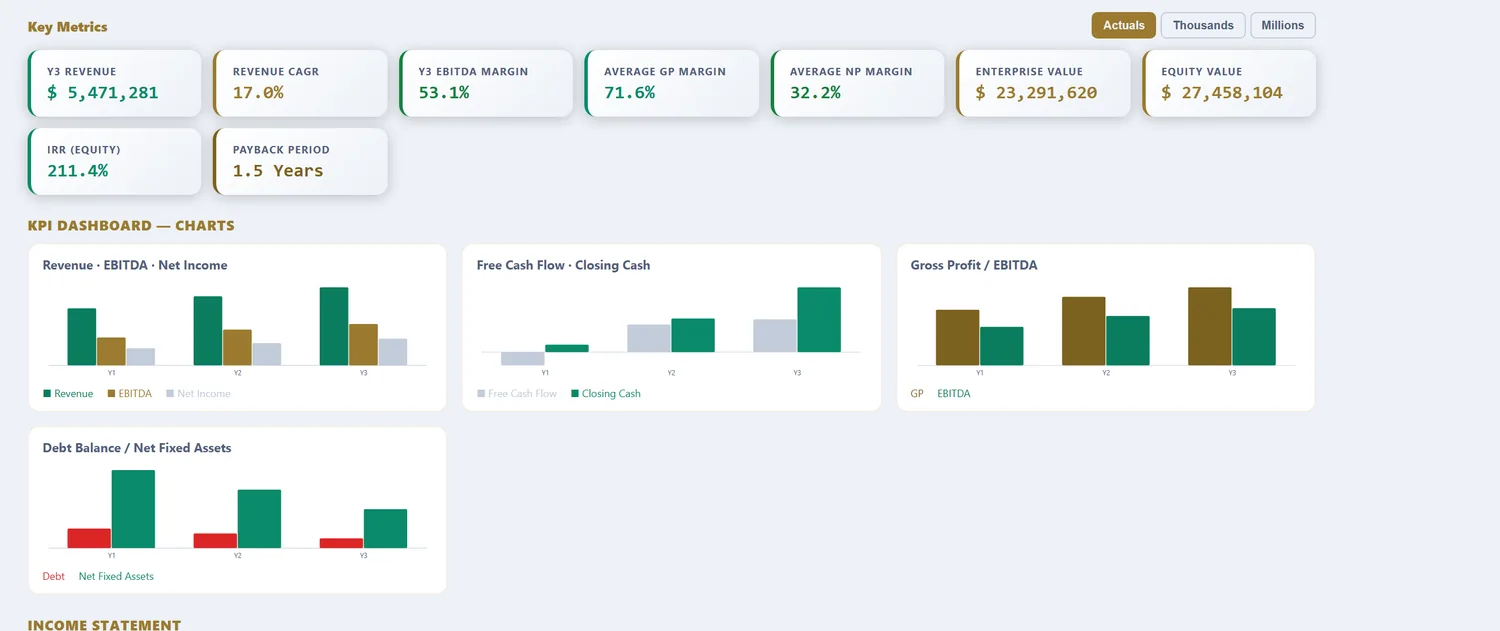
A 16-sheet, fully formula-linked Excel workbook: Assumptions, Revenue, OPEX, CAPEX & Depreciation, Debt, Tax (with loss carryforward), Income Statement, Cash Flow, Balance Sheet, DCF Valuation, Sensitivity tables, a charted KPI Dashboard, a Scenarios sheet (Base, Best & Worst), and an Integrity Check. Free 16-sheet linked Excel download for models up to 3 years (annual or quarterly, just your email). Models from 5 to 25 years are $29.98 per model download.
What a pharma financial model computes
Pharmaceutical distribution is a high-volume, thin-margin logistics business wrapped in regulation, and the model exists to show whether volume and cash efficiency can carry a slender markup. Revenue is units multiplied by price, but the price is shaped by reimbursement and regulation rather than set freely, and the cost of goods is high, often near 68%, because the distributor buys finished medicines and adds mostly handling. The two forces that decide the outcome are volume against a thin margin, and the working-capital cycle of holding deep inventory while extending credit to customers. A generic template assumes a comfortable margin and light working capital, and misses exactly what makes pharma distribution hard.
The template loads distribution-scale defaults: revenue from units and price, cost of goods near 68%, and a heavy inventory-led working-capital cycle. What follows is what each part does with real pharma numbers in it.
Where in the chain changes the model
Before any numbers, the position in the pharmaceutical chain sets the margin and the risk.
| Position | Revenue basis | Margin | Modelling focus |
|---|---|---|---|
| Wholesale distribution | Units × price, high volume | Very thin | Volume, working capital, logistics |
| Specialty distribution | High-value, cold-chain | Higher, service-led | Handling, compliance, fewer units |
| Retail pharmacy | Dispensing + retail | Moderate, reimbursed | Scripts, reimbursement, footfall |
| Manufacturer | Product × price | High, but R&D-heavy | Pipeline, patents, approval |
A wholesale distributor moves huge volumes at a razor-thin margin, so the whole model is volume and working-capital efficiency. Specialty distribution handles high-value, cold-chain or complex products where service commands a better margin against fewer units. A retail pharmacy dispenses against reimbursement schedules and adds front-of-store retail. A manufacturer earns high margins on products but carries R&D and patent risk entirely different from distribution. The template keeps the position explicit because margin and risk shift dramatically along the chain.
Thin margins and the volume engine
A distributor's economics are unforgiving, and the P&L reflects it.
| Line | Share of revenue | Note |
|---|---|---|
| Cost of goods | ~68% | Medicines bought from manufacturers |
| Logistics & handling | 8-12% | Warehousing, cold chain, delivery |
| Overhead & compliance | 8-12% | Regulatory, admin, systems |
| = Operating margin | High single to low double digits | Made up on volume and cash efficiency |
With cost of goods near 68% and heavy logistics and compliance on top, the operating margin is modest and highly sensitive to volume, so a distributor cannot afford waste anywhere. That is why scale matters so much: fixed logistics and compliance costs spread over more volume are the main route to a workable return, and why consolidation defines the sector. The model separates the high pass-through cost of goods from the fixed operating costs so the operating leverage of volume is visible rather than lost in a blended margin.
The four assumptions that decide pharma returns
| Assumption | Typical range | Why it dominates |
|---|---|---|
| Volume growth | Market-dependent | Thin margin, so scale is everything |
| Operating margin | Modest, volume-bound | Small changes swing profit hard |
| Inventory days | Substantial | The dominant cash tie-up |
| Payment terms (DSO vs DPO) | Customer vs supplier | The cash gap or cushion |
Volume is the engine because the margin is too thin to profit any other way, so growth that spreads fixed cost is the main lever. Margin is so slender that a small change, a reimbursement cut or a cost creep, swings profit disproportionately. Inventory days set the cash tied up in stock, and the gap between what customers owe and what suppliers are owed, DSO against DPO, is either a drain or a cushion. The model runs all four so a thin-margin business is judged on the cash it consumes as much as the profit it books.
Worked example: a pharma distributor, in numbers
| Input | Value |
|---|---|
| Annual revenue | $80M |
| Cost of goods | 68% |
| Gross margin | 32% |
| Logistics & overhead | ~22% of revenue |
| Operating margin | ~10% |
| Inventory days | 45 |
| Receivable days | 50 |
| Payable days | 35 |
| Cash cycle | ~60 days |
From volume to margin and cash
$80M of revenue at a 68% cost of goods leaves about $25.6M of gross profit, and after logistics and overhead near 22% the operating margin lands around 10%, workable but exposed to any slip in volume or buying terms. The profit is only part of the story. With 45 inventory days, 50 receivable days and 35 payable days, the cash conversion cycle runs near 60 days, so a large slice of the year's revenue is permanently tied up in stock and receivables, and growth widens it: scaling revenue 20% means funding 20% more inventory and credit before the extra cash arrives. That is why a pharma distributor is judged on its cash cycle as hard as its margin, and why consolidation and scale, spreading fixed cost and improving buying terms, drive the sector. Over a 3 to 25-year horizon the model runs the margin, funds the working-capital growth, and produces the DCF and IRR, where volume and cash efficiency decide the return.
Regulation, reimbursement and price
Unlike most businesses, a pharma distributor does not fully set its own prices, and the model has to respect that. Reimbursement schedules set by health systems cap what many medicines effectively sell for, mandated distribution margins in some markets fix the distributor's cut directly, and product approvals gate what can be carried at all. A change in any of these, a reimbursement cut, a margin regulation, a delisting, flows straight through a thin-margin business and can turn a profit into a loss with no operational change at all. The model treats price and margin as regulated inputs rather than market-set assumptions, so the sensitivity to a policy change is explicit and can be stressed, which for a regulated, low-margin sector is often the most important risk the forecast has to carry. A distributor also depends on the mix of products it carries, because generics, branded medicines and specialty or cold-chain lines each carry different margins and different handling costs, and a shift in that mix, driven by patent expiries or a formulary change, moves the blended margin as surely as a price cut, which is why the model keeps room to stress the product mix alongside the regulated price.
Pharma model vs a generic financial model
| What differs | Generic model | Pharma financial model |
|---|---|---|
| Revenue driver | Price × volume | Units × regulated price, high volume |
| Margin | Comfortable | Modest; volume- and scale-dependent |
| Pricing | Market-set | Reimbursement and regulation |
| Working capital | Minor | Inventory-led, the binding constraint |
| Key risk | Margin | Cash cycle and regulatory change |
Sector data on drug spending, pricing and distribution for grounding assumptions is published by the US Food and Drug Administration and national health statistics; the FDA is the standard reference for approvals and the regulated environment.
Reference: US Food and Drug Administration — Drugs, the reference for the regulated pharmaceutical environment and approvals.
How to download your pharma model (3 steps)
- Choose the Pharma / Distribution template. The units, price, cost-of-goods and inventory defaults load as editable inputs.
- Set your own volumes, margins, inventory and payment days. Pick annual or quarterly periods and a 3 to 25-year horizon.
- Preview the linked statements, margin, cash cycle and IRR, then download the Excel workbook. Up to 3 years is free with just your email; longer horizons are a one-time purchase.
Three focused variants build on the same pharma engine: the pharma cash flow forecasting model for the inventory cash cycle, the pharma DCF valuation model for enterprise value and IRR, and the pharma free cash flow model for the cash bridge.
Frequently asked questions
Why is working capital critical in pharma distribution?
Distributors carry large inventory and extend credit to pharmacies; the 60-day default working-capital cycle shows exactly how growth consumes cash.
What margins are realistic?
Wholesale pharma gross margins run 25–35%; the template defaults to 32% and is editable.
Can I model regulatory or licensing costs?
Add them under G&A or as a dedicated cost line with its own inflation.
Why is pharma distribution a thin-margin, volume business?
Because a distributor buys finished medicines from manufacturers and resells to pharmacies and hospitals, adding logistics, cold-chain and compliance rather than transformation, so the value added is modest against the value of the goods. What gross margin there is gets compressed by heavy operating and working-capital demands, so the business runs on volume and cash-cycle efficiency rather than markup, which is why the model tracks inventory and receivables as closely as sales.
How much working capital does a pharma distributor need?
A great deal, because it holds large inventories of many products to guarantee availability, and sells to pharmacies and hospitals on credit terms while often paying manufacturers faster. That mismatch ties up substantial cash, and it grows with the business. The model turns inventory and payment days into the working-capital movement, because for a thin-margin distributor the cash cycle, not the margin, is usually the binding constraint.
How does regulation affect a pharma financial model?
Pricing, reimbursement and approval are all regulated, so revenue is less free than in an ordinary business. Reimbursement schedules cap effective prices, mandatory margins can fix the distributor's cut, and product approvals gate what can be sold. The model treats price and margin as regulated inputs rather than market-set, so a change in reimbursement or a mandated margin flows through explicitly rather than being assumed away.
Pharma across our four models
Pharma / Distribution Cashflow Forecasting Model · Pharma / Distribution DCF Valuation Model · Pharma / Distribution Free Cashflow Model
More industry financial models
SaaS / Subscription financial model · Data Center financial model · Real Estate financial model · Manufacturing financial model · Hotel / Hospitality financial model · E-commerce / Retail financial model · Healthcare / Clinic financial model · Fintech / Lending financial model · Energy / Solar financial model · Early-Stage Startup financial model · Restaurant / F&B financial model · Professional Services financial model · Logistics / Transport financial model · Education / Training financial model · Construction financial model · Media / Content financial model · Telecom / ISP financial model · Agriculture financial model · Fitness / Wellness financial model · Nonprofit / NGO financial model · Pricing
Free tools
WACC calculator · CAPM calculator · DCF calculator · IRR calculator · Inside the 16-sheet model · Glossary