Hotel Financial Model in Excel (Free RevPAR & GOP Download)
A hotel financial model projects rooms revenue (keys × occupancy × ADR) plus food-and-beverage income against property CAPEX, staffing and debt service, producing linked statements, DCF valuation and equity IRR. Generate a 16-sheet Excel hotel model free for up to 3 years, or 25 years with premium.
⚡ Generate my Hotel / Hospitality model — free (requires JavaScript)
The fastest way to an investor-ready hotel / hospitality financial model is a template pre-loaded with the industry's real revenue drivers and cost structure. This generator builds a 16-sheet, fully formula-linked Excel workbook — three statements, DCF & IRR — around hotel / hospitality-specific assumptions in about five minutes. Free up to 3 years, just your email.
Key drivers pre-loaded in this template
| Rooms × ADR | Core rooms-revenue build |
| F&B revenue stream | Restaurant and banqueting income |
| $6M property CAPEX default | Hotel-scale asset base and depreciation |
| WACC ~12% | Hospitality-sector discount rate default |
What you get
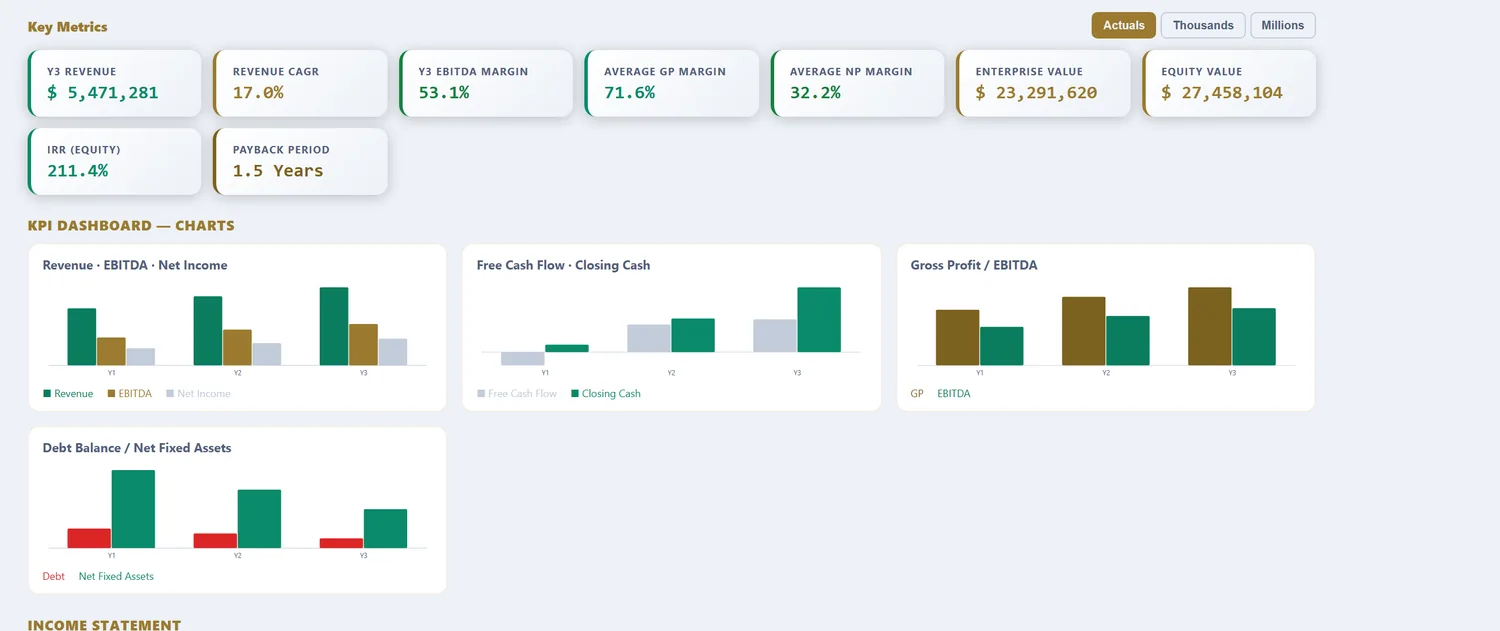
A 16-sheet, fully formula-linked Excel workbook: Assumptions, Revenue, OPEX, CAPEX & Depreciation, Debt, Tax (with loss carryforward), Income Statement, Cash Flow, Balance Sheet, DCF Valuation, Sensitivity tables, a charted KPI Dashboard, a Scenarios sheet (Base, Best & Worst), and an Integrity Check. Free 16-sheet linked Excel download for models up to 3 years (annual or quarterly, just your email). Models from 5 to 25 years are $29.98 per model download.
What a hotel financial model computes
A hotel is a perishable-inventory business with a heavy fixed-cost base, and the model exists to manage that tension. A room unsold tonight is revenue gone forever, so the commercial game is filling keys at the best rate, captured in RevPAR. Around rooms sit food and beverage, events and other income, each with its own margin. The costs split into departmental costs that vary with occupancy, undistributed costs that are largely fixed, and true fixed charges below gross operating profit. A generic template collapses all of this into one margin and misses the two things that actually move hotel returns: the operating leverage on RevPAR and the capital the property quietly consumes to stay current.
The template loads property-scale defaults: rooms revenue driven by keys, occupancy and ADR, food and beverage alongside it, an FF&E reserve on the CAPEX schedule, and a management fee. What follows is what each part does with real hospitality numbers in it.
Hotel types change the model
Before any numbers, the property type sets the revenue mix and the cost shape. A limited-service roadside hotel is a different business from a full-service resort.
| Type | Revenue mix | Cost shape | Modelling focus |
|---|---|---|---|
| Limited-service | Mostly rooms | Lean, high GOP margin | RevPAR, occupancy, low F&B |
| Full-service | Rooms + significant F&B | Higher labour, lower margin | F&B margin, departmental cost |
| Resort | Rooms + F&B + amenities | Seasonal, capital-heavy | Seasonality, other income, FF&E |
| Extended-stay | Rooms, longer bookings | Very lean, high occupancy | Length of stay, low turnover cost |
Limited-service hotels are close to a pure rooms business, so they run high gross operating margins and live on RevPAR. Full-service properties add meaningful food and beverage, which brings revenue but also labour, so the F&B margin matters as much as the rooms rate. Resorts layer amenities and pronounced seasonality on top, and consume capital faster. Extended-stay trades nightly rate for length of stay and low turnover cost, which is why its margins can rival limited-service. The model keeps rooms and F&B as separate streams so a full-service property does not hide a weak restaurant inside a strong rooms number.
The revenue build: RevPAR and beyond
Rooms revenue is keys multiplied by occupancy multiplied by ADR, and RevPAR is the shorthand that combines the last two into one performance number.
| Metric | Definition | What it reveals |
|---|---|---|
| Occupancy | Rooms sold ÷ available | How full the hotel runs |
| ADR | Rooms revenue ÷ rooms sold | The average rate achieved |
| RevPAR | ADR × occupancy | Combined commercial performance |
| GOPPAR | GOP ÷ available rooms | Profit efficiency per room |
Occupancy and ADR pull against each other: dropping rate fills rooms, holding rate protects margin, and RevPAR is the referee that says which strategy actually won. GOPPAR takes it one step further, measuring profit rather than revenue per available room, which is where a hotel with lower occupancy but disciplined cost can beat a busier rival. The model tracks all four so a rate strategy can be judged on profit, not just on how full the car park looks.
The four assumptions that decide hotel returns
| Assumption | Typical range | Why it dominates |
|---|---|---|
| Occupancy | 60-80% stabilised | Fills a largely fixed cost base |
| ADR / RevPAR | Market-dependent | Rate flows heavily to profit |
| GOP margin | 35-45% | How well the property is run |
| Exit cap rate / per-key value | Market-dependent | Sets the sale value at exit |
Occupancy fills the fixed base, so the move from 65% to 75% is almost pure profit. ADR is the rate lever, and because the marginal cost of an occupied room is small, most of a rate increase reaches gross operating profit. GOP margin is the operating scorecard. And at exit, the cap rate applied to stabilised net operating income, or a per-key valuation, sets the sale value, which for a hold is where most of the return is realised. The model carries all four across the horizon so a refurbishment or a repositioning can be tested on the number that matters.
Worked example: a 120-key hotel, in numbers
| Input | Value |
|---|---|
| Keys | 120 |
| Occupancy | 72% |
| ADR | $140 |
| RevPAR | $100.80 |
| Rooms revenue | ~$4.4M |
| F&B and other | +35% of rooms |
| GOP margin | 40% |
| FF&E reserve | 4% of revenue |
| Management fee | 3% of revenue |
From RevPAR to GOP and IRR
120 keys at 72% occupancy is about 31,500 room-nights a year, and at a $140 rate that is roughly $4.4M of rooms revenue, with food, beverage and other income lifting the total near $6.0M. At a 40% gross operating margin the property produces about $2.4M of GOP, from which the management fee, the FF&E reserve and the fixed charges are taken to reach net operating income. Now lift occupancy two points and ADR five dollars: RevPAR climbs, and because the cost base barely moves, most of that extra revenue lands in GOP. That leverage is why revenue management is the heart of hotel finance, and why the sensitivity tables here focus on occupancy and rate. Over a 3 to 25-year hold the model funds the periodic refurbishment, applies the exit cap rate to stabilised NOI, and produces the levered IRR an owner underwrites to.
Seasonality and the cash it demands
Few hotels run flat across the year. A resort can do half its business in one quarter, and even a city hotel swings with events and weekday-versus-weekend demand. That matters for cash as much as for profit, because fixed costs run all year while revenue concentrates in the strong months, so the shoulder season can burn cash even in a profitable year. The model lets occupancy and rate vary by period, monthly or quarterly, so the low-season funding need is visible and can be financed deliberately rather than discovered when a quiet January arrives.
Hotel model vs a generic financial model
| What differs | Generic model | Hotel financial model |
|---|---|---|
| Revenue driver | Price × volume | Keys × occupancy × ADR, plus F&B |
| Key metric | Gross margin | RevPAR and GOPPAR |
| Cost logic | Blended | Departmental, undistributed, fixed charges |
| CAPEX | Steady spend | FF&E reserve plus refurbishment cycle |
| Seasonality | Flat | Occupancy and rate vary by period |
Occupancy, ADR and RevPAR benchmarks by market and class are tracked by STR, the standard hospitality data provider, which is the reference most owners and lenders use to calibrate assumptions.
Reference: STR, the standard provider of occupancy, ADR and RevPAR benchmarks by hotel market and class.
How to download your hotel model (3 steps)
- Choose the Hotel / Hospitality template. The keys, occupancy, ADR, F&B and FF&E defaults load as editable inputs.
- Set your own occupancy, ADR, F&B mix, GOP margin, management fee and refurbishment schedule. Pick annual or quarterly periods and a 3 to 25-year horizon.
- Preview the linked statements, RevPAR, GOP, IRR and DCF, then download the Excel workbook. Up to 3 years is free with just your email; longer horizons are a one-time purchase.
Three focused variants build on the same hotel engine: the hotel cash flow forecasting model for seasonal cash, the hotel DCF valuation model for enterprise value and IRR, and the hotel free cash flow model for the FF&E-to-FCF bridge and peak funding need.
Frequently asked questions
What horizon do hotel investors expect?
Hotel developments and acquisitions are typically underwritten over 10–25 years to match asset life and loan terms — supported by the premium tier; 5-year operating plans are free.
Does it model occupancy ramp-up?
Yes — growth bands let revenue ramp steeply in early years and stabilize later, mirroring a typical opening curve.
Can lenders use this model?
Yes — the output includes a full debt schedule with interest, repayment and coverage, plus balance-sheet integrity checks.
What is RevPAR and why does it matter?
RevPAR, revenue per available room, is average daily rate multiplied by occupancy, and it is the single number that captures a hotel's commercial performance. It rewards filling rooms and charging more at the same time, so two hotels with the same occupancy but different rates, or the same rate at different occupancy, are separated cleanly. Because most hotel cost is fixed, a small RevPAR gain flows heavily to profit.
What is GOP and how does it differ from net profit?
Gross operating profit is revenue less departmental and undistributed operating costs, before fixed charges like property tax, insurance, rent and the management fee. It is the standard measure of how well the hotel is run day to day, because it strips out ownership and financing decisions. GOP margins commonly run 35-45%; what reaches net profit is lower once the fixed charges and the FF&E reserve are taken.
What is an FF&E reserve and why model it?
Furniture, fixtures and equipment wear out, and hotels set aside a reserve, typically 3-5% of revenue, to replace them: soft goods every few years, a full refurbishment every seven to ten. A model that skips the reserve overstates cash and understates the capital a hotel actually consumes to stay competitive. The CAPEX schedule stages the reserve and the periodic refurbishment so the later years stay honest.
Hotel across our four models
Hotel / Hospitality Cashflow Forecasting Model · Hotel / Hospitality DCF Valuation Model · Hotel / Hospitality Free Cashflow Model
More industry financial models
SaaS / Subscription financial model · Data Center financial model · Real Estate financial model · Manufacturing financial model · E-commerce / Retail financial model · Healthcare / Clinic financial model · Fintech / Lending financial model · Energy / Solar financial model · Early-Stage Startup financial model · Restaurant / F&B financial model · Professional Services financial model · Logistics / Transport financial model · Education / Training financial model · Construction financial model · Media / Content financial model · Telecom / ISP financial model · Agriculture financial model · Pharma / Distribution financial model · Fitness / Wellness financial model · Nonprofit / NGO financial model · Pricing
Free tools
WACC calculator · CAPM calculator · DCF calculator · IRR calculator · Inside the 16-sheet model · Glossary