Healthcare Financial Model in Excel (Free Clinic & Provider Download)
A healthcare or clinic financial model projects consultation and diagnostics revenue from patient visits × average fee, against clinical staffing, equipment CAPEX and facility costs, producing linked statements with DCF and IRR. Generate a 16-sheet Excel model free for up to 3 years.
⚡ Generate my Healthcare / Clinic model — free (requires JavaScript)
The fastest way to an investor-ready healthcare / clinic financial model is a template pre-loaded with the industry's real revenue drivers and cost structure. This generator builds a 16-sheet, fully formula-linked Excel workbook — three statements, DCF & IRR — around healthcare / clinic-specific assumptions in about five minutes. Free up to 3 years, just your email.
Key drivers pre-loaded in this template
| Visits × fee | Patient-volume revenue build |
| Diagnostics stream | Lab and imaging income |
| COGS ~30% | Consumables and clinical supplies |
| WACC ~11% | Defensive-sector discount rate |
What you get
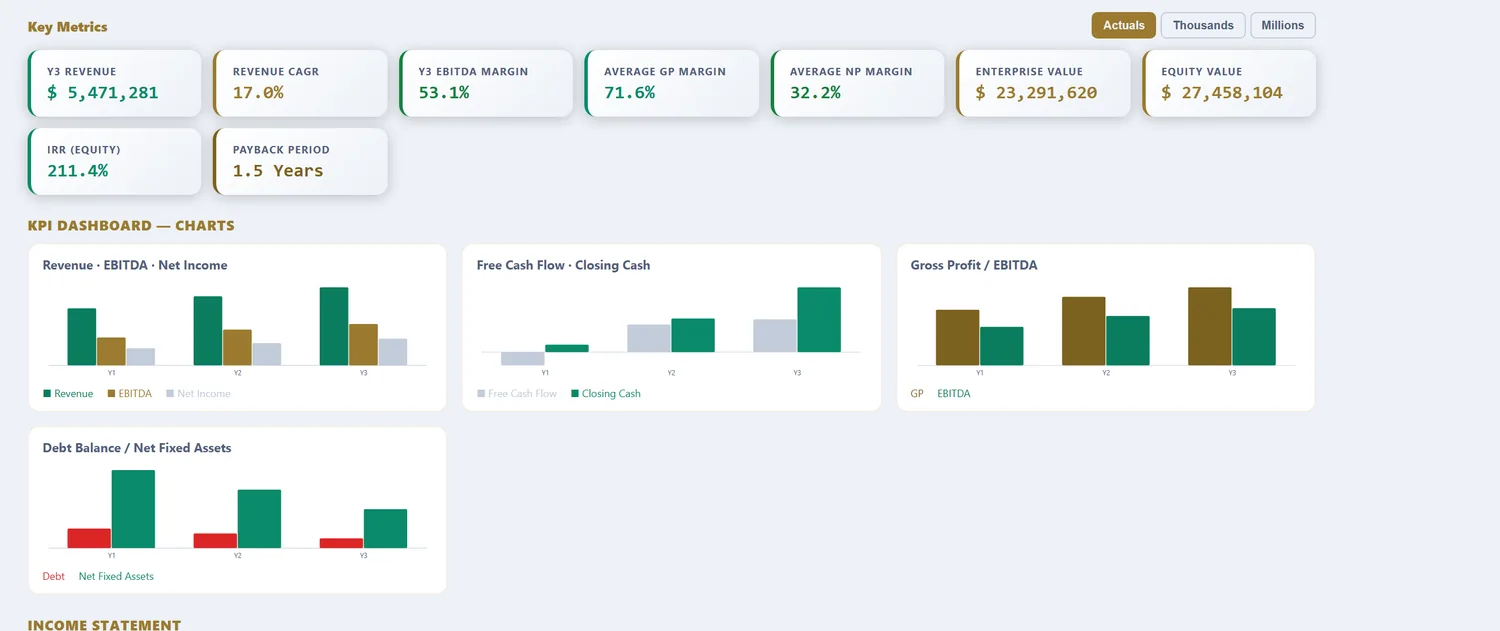
A 16-sheet, fully formula-linked Excel workbook: Assumptions, Revenue, OPEX, CAPEX & Depreciation, Debt, Tax (with loss carryforward), Income Statement, Cash Flow, Balance Sheet, DCF Valuation, Sensitivity tables, a charted KPI Dashboard, a Scenarios sheet (Base, Best & Worst), and an Integrity Check. Free 16-sheet linked Excel download for models up to 3 years (annual or quarterly, just your email). Models from 5 to 25 years are $29.98 per model download.
What a healthcare financial model computes
A clinic or provider group is a capacity business: it sells the time of expensive, licensed people, and the model is about filling that time profitably. Revenue is patient volume multiplied by an average fee, but the fee is a blend set by payer mix, because the same consultation pays one rate from a commercial insurer and a lower one from Medicaid. Against revenue sit clinical staffing, which behaves as a step cost rather than a smooth percentage, consumables that scale with volume, and largely fixed facility and equipment costs. A generic template blurs all three, and the payer-mix effect, into a single margin that hides where a practice actually makes or loses money.
The template loads provider-scale defaults: consultation and diagnostics revenue driven by visits and fees, staffing as the dominant cost, medical equipment on the CAPEX schedule, and insurance receivables that collect slowly. What follows is what each part does with real healthcare numbers in it.
Provider types change the model
Before any numbers, the care setting decides the revenue and cost shape. A primary-care clinic looks nothing like an imaging centre or a multi-site group.
| Setting | Revenue basis | Cost focus | Modelling note |
|---|---|---|---|
| Primary care / clinic | Visits × fee, payer mix | Provider time, low equipment | Volume, provider utilization |
| Diagnostics / imaging | Scans × fee | Heavy equipment, fixed | CAPEX, utilization, depreciation |
| Specialty / surgical | Procedures × fee | High staffing + consumables | Procedure mix, theatre time |
| Multi-site group | Blended across sites | Overhead, central admin | Site ramp, shared services |
Primary care turns on provider utilization: fill the schedule and it works, leave gaps and the fixed salary bleeds. Imaging is a CAPEX business where an expensive scanner has to run enough studies to cover its depreciation. Specialty and surgical care carries both high staffing and consumable intensity, so the procedure mix drives everything. A multi-site group adds central overhead and the ramp of each new location, which the model stages so a new site's early losses do not hide inside the group average.
Revenue: volume, fee and the payer-mix blend
Healthcare revenue is deceptively simple to state and easy to get wrong. Volume times fee, where the fee is a weighted average across payers.
| Payer | Relative rate | Collection | Modelling note |
|---|---|---|---|
| Commercial insurance | Highest | 30-45 days | The margin anchor |
| Medicare | Moderate | Predictable | Volume backbone for many practices |
| Medicaid | Lowest | Slower | Dilutes the blended fee |
| Self-pay | Variable | Fast but partial | Bad-debt risk |
The blended fee is what actually lands, and it moves with the mix, not just with the list price. A practice that grows volume while its mix drifts toward lower-reimbursement payers can grow revenue far slower than visits, or even shrink margin while getting busier. The model keeps the mix as an explicit driver so that effect is visible rather than smuggled into an average.
The four assumptions that decide healthcare returns
| Assumption | Typical range | Why it dominates |
|---|---|---|
| Patient volume / provider utilization | Fill rate of the schedule | Spreads fixed staff cost |
| Payer mix / effective fee | Commercial vs government | Sets revenue per visit |
| Clinical staffing % of revenue | 50-60% | The dominant, step-shaped cost |
| Receivable days | 30-60+ days | The cash gap from slow claims |
Utilization spreads the salaried cost of providers, so a half-full schedule is the fastest way to lose money in a clinic. Payer mix sets what each visit is worth. Staffing is the biggest line and the trickiest, because it steps up with each hire. And receivable days set the cash gap, because revenue is earned at the visit but collected weeks later through the claims process, sometimes after a denial and a rework.
Worked example: a multi-provider clinic, in numbers
| Input | Value |
|---|---|
| Providers | 6 |
| Visits per provider / yr | 4,000 |
| Total visits | 24,000 |
| Effective fee (blended) | $120 |
| Revenue | $2.88M |
| Clinical staffing | 55% of revenue |
| Consumables | 8% of revenue |
| Equipment CAPEX | $400,000, 7-yr life |
| Receivable days | 45 |
From visits to margin and IRR
Six providers seeing 4,000 patients a year is 24,000 visits, and at a $120 blended fee that is $2.88M of revenue. Clinical staffing at 55% is the anchor cost, and after consumables, facility and admin the operating margin for an established clinic lands in the mid-teens. The sensitivity is all in utilization and mix: drop each provider to 3,000 visits and the fixed salaries no longer cover themselves, while a shift of the payer mix toward commercial insurance lifts the effective fee and flows almost straight to margin. Over a 3 to 25-year horizon the model funds the equipment replacement, carries the slow receivables, and shows how a new provider dilutes margin while ramping, which is exactly the picture a lender or buyer wants to see, and where the DCF and sensitivity tables do their work.
Claim denials and bad debt: the revenue you bill but never collect
A number every healthcare model needs and most ignore is the gap between what a practice bills and what it actually collects. Insurers deny or reduce a meaningful share of claims on first submission, for coding errors, eligibility issues or prior-authorisation gaps, and each denial has to be reworked and resubmitted, or written off. Initial denial rates in the high single digits to low teens are common across the sector, and a share of those are never recovered, so net collection rates below the gross charge are the norm, not the exception, and a model that books full billed revenue overstates both cash and profit. Self-pay balances add bad-debt risk on top, and in practices with a large uninsured share that allowance can be the difference between a forecast that holds and one that quietly misses all year. The right approach is to model revenue net of an expected denial and bad-debt allowance, and to keep receivable days honest so the rework lag shows in cash. A practice can look healthy on billed revenue and still be starved of cash if a rising share of claims stalls in denial, which is exactly the failure the model is built to surface before it compounds.
Healthcare model vs a generic financial model
| What differs | Generic model | Healthcare financial model |
|---|---|---|
| Revenue driver | Price × volume | Visits × fee, blended by payer mix |
| Effective price | Single price | Payer-mix weighted, moves with the mix |
| Main cost | Blended margin | Clinical staffing as a step cost |
| Collection | Paid on sale | Insurance receivables, 30-60+ days |
| CAPEX | Steady spend | Medical equipment with replacement |
Long-run sector growth for the terminal assumptions is published by the Centers for Medicare & Medicaid Services in the National Health Expenditure projections, the standard reference for how fast US healthcare spending grows.
Reference: CMS — National Health Expenditure Data, the standard US projection series for long-run healthcare spending. For a valuation-first view, use the healthcare DCF valuation model.
How to download your healthcare model (3 steps)
- Choose the Healthcare / Clinic template. The visit, fee, payer-mix and staffing defaults load as editable inputs.
- Set your own volumes, blended fee, staffing, consumables, equipment CAPEX and receivable days. Pick annual or quarterly periods and a 3 to 25-year horizon.
- Preview the linked statements, margin, IRR and DCF, then download the Excel workbook. Up to 3 years is free with just your email; longer horizons are a one-time purchase.
Three focused variants build on the same healthcare engine: the healthcare cash flow forecasting model for the receivables cash gap, the healthcare DCF valuation model for enterprise value and IRR, and the healthcare free cash flow model for the CAPEX-to-FCF bridge and peak funding need.
Frequently asked questions
Can I model a multi-service clinic?
Yes — up to three revenue streams, e.g. consultations, diagnostics and pharmacy, each with independent growth.
How is medical equipment handled?
As CAPEX with its own useful life and depreciation schedule feeding the balance sheet.
What horizon suits a hospital project?
Clinics plan 3–5 years (free); hospital builds are appraised over 15–25 years, available with premium.
How does payer mix affect a clinic's revenue?
Payer mix is the split of revenue between private insurance, Medicare, Medicaid and self-pay, and each pays a different rate for the same service. Government reimbursement typically pays well below commercial rates, so a shift of 10-15 points toward Medicaid can cut the effective fee with no change in patient volume at all. The model sets the mix explicitly so the blended fee reflects who is actually paying.
Why is clinical staffing a step cost, not a variable cost?
Because you hire a practitioner whole, not by the patient. A physician, nurse or technician adds a block of salary and a block of capacity at once, so cost jumps when you add a provider and then sits flat until that provider is full. Staffing usually runs 50-60% of revenue, and modelling it as a smooth percentage hides the utilization gap right after each hire, which is where new-provider clinics lose money.
How long do healthcare receivables take to collect?
Longer than most businesses, because payment comes from insurers through a claims process, not from the patient at the desk. Days in accounts receivable of 30-60 are normal, and denied or reworked claims stretch it further. That slow, uncertain collection is why a profitable practice can still be tight on cash, and why the model tracks receivable days rather than assuming payment on service.
Healthcare across our four models
Healthcare / Clinic Cashflow Forecasting Model · Healthcare / Clinic DCF Valuation Model · Healthcare / Clinic Free Cashflow Model
More industry financial models
SaaS / Subscription financial model · Data Center financial model · Real Estate financial model · Manufacturing financial model · Hotel / Hospitality financial model · E-commerce / Retail financial model · Fintech / Lending financial model · Energy / Solar financial model · Early-Stage Startup financial model · Restaurant / F&B financial model · Professional Services financial model · Logistics / Transport financial model · Education / Training financial model · Construction financial model · Media / Content financial model · Telecom / ISP financial model · Agriculture financial model · Pharma / Distribution financial model · Fitness / Wellness financial model · Nonprofit / NGO financial model · Pricing
Free tools
WACC calculator · CAPM calculator · DCF calculator · IRR calculator · Inside the 16-sheet model · Glossary