Telecom Financial Model in Excel (Free ISP & Subscriber Download)
A telecom or ISP financial model projects subscription revenue (subscribers × ARPU) plus installation income against heavy network CAPEX, debt service and operations costs. Network investments pay back over decades, so long-horizon DCF matters — generate a 16-sheet Excel model free for up to 3 years, or 25 with premium.
⚡ Generate my Telecom / ISP model — free (requires JavaScript)
The fastest way to an investor-ready telecom / isp financial model is a template pre-loaded with the industry's real revenue drivers and cost structure. This generator builds a 16-sheet, fully formula-linked Excel workbook — three statements, DCF & IRR — around telecom / isp-specific assumptions in about five minutes. Free up to 3 years, just your email.
Key drivers pre-loaded in this template
| Subscribers × ARPU | Recurring connectivity revenue |
| Installation & equipment | One-off connection income |
| Network CAPEX $4M default | Fibre/tower build with $3M debt |
| WACC ~10% | Utility-like discount rate, EV/EBITDA ~9x |
What you get
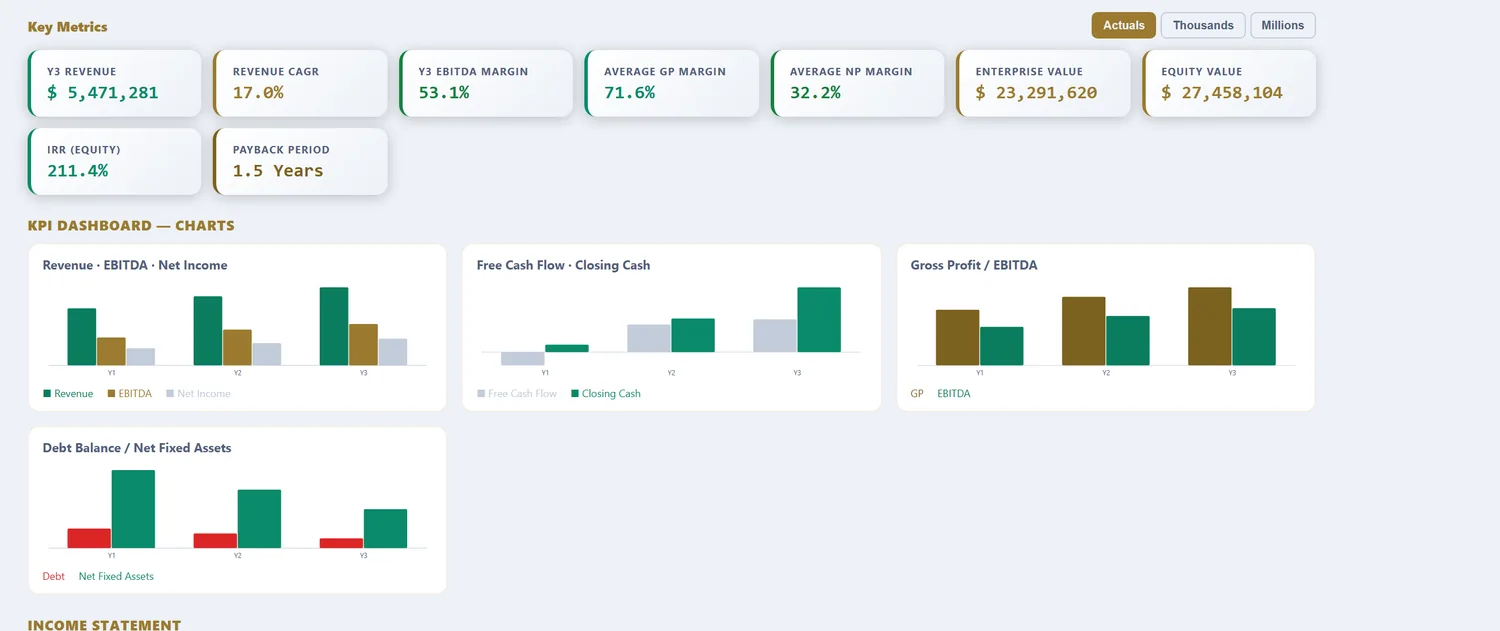
A 16-sheet, fully formula-linked Excel workbook: Assumptions, Revenue, OPEX, CAPEX & Depreciation, Debt, Tax (with loss carryforward), Income Statement, Cash Flow, Balance Sheet, DCF Valuation, Sensitivity tables, a charted KPI Dashboard, a Scenarios sheet (Base, Best & Worst), and an Integrity Check. Free 16-sheet linked Excel download for models up to 3 years (annual or quarterly, just your email). Models from 5 to 25 years are $29.98 per model download.
What a telecom financial model computes
A telecom or ISP is a network business: enormous cost up front to build, then years of recurring revenue from subscribers riding on it. The model exists to show whether the network fills fast enough to earn back the capital. Revenue is subscribers multiplied by ARPU, eroded by churn and grown by additions, plus one-off connection income. The cost base is dominated by fixed network operations and depreciation, which is why telecom runs high EBITDA margins and heavy capital charges at the same time. The two forces that decide the return are ARPU against churn on the revenue side, and CAPEX intensity against utilization on the cost side. A generic template captures none of this, treating a capital machine like a normal margin business.
The template loads operator-scale defaults: recurring revenue from subscribers and ARPU, network CAPEX on the schedule with real depreciation, and the churn and additions that move the base. What follows is what each part does with real telecom numbers in it.
Operator types change the model
Before any numbers, the operator type sets the CAPEX profile and the revenue logic.
| Type | Revenue basis | CAPEX profile | Modelling focus |
|---|---|---|---|
| Fixed broadband / ISP | Subscribers × monthly ARPU | Heavy build, then maintenance | Penetration, homes passed, take rate |
| Mobile network | Subscribers × ARPU + data | Spectrum + towers | Coverage, data ARPU, churn |
| Wholesale / infrastructure | Capacity leased to others | Very heavy, long-lived | Utilization, contract length |
| Reseller / MVNO | Subscribers × ARPU | Light (leases the network) | Margin per subscriber, churn |
A fixed broadband operator lives on penetration: it passes homes with fibre at heavy cost, then earns on the share that actually subscribe, so homes-passed and take-rate are everything. A mobile operator layers spectrum and coverage on top, with data driving ARPU. Wholesale infrastructure leases capacity to other operators, so utilization and contract length decide the return on very long-lived assets. A reseller or MVNO leases someone else's network and turns light, living on margin per subscriber. The template keeps the CAPEX profile explicit because it is what separates these businesses.
The revenue build: subscribers, ARPU and churn
Telecom revenue is a subscriber base that has to be defended as much as grown.
| Component | What it is | Sign |
|---|---|---|
| Opening subscribers | Base carried in | Base |
| + Gross additions | New connections won | Add |
| − Churned subscribers | Disconnections | Subtract |
| = Closing subscribers | Base carried out | Result |
| × ARPU | Average revenue per user | Revenue |
Net subscriber growth is gross additions minus churn, and the churn line is the one operators fight hardest, because every disconnection has to be replaced by an expensive new connection before the base even grows. ARPU is the other half: on a fixed network, lifting ARPU through faster tiers or bundled services flows almost straight to profit. The model separates additions, churn and ARPU so a growth plan built on discounting to win subscribers reads differently from one built on raising ARPU on a loyal base.
The four assumptions that decide telecom returns
| Assumption | Typical range | Why it dominates |
|---|---|---|
| ARPU | Market-dependent | Flows to profit on a fixed base |
| Churn | Low single digits monthly | Compounds against the base |
| CAPEX intensity | 15-25% in build phase | The capital to be earned back |
| Penetration / take rate | Share of homes passed | Fills the fixed network |
ARPU and churn together set the revenue trajectory, and because the network cost is fixed, both move profit hard. CAPEX intensity is the capital the business has to earn back, front-loaded and depreciating for years. And penetration is what fills the network: a fibre build passing 100,000 homes earns nothing until households actually subscribe, so take-rate is the difference between a stranded asset and a cash machine. The model runs all four so a build plan is judged on the subscribers it eventually captures, not the homes it passes.
Worked example: a regional ISP, in numbers
| Input | Value |
|---|---|
| Homes passed | 100,000 |
| Take rate (stabilised) | 40% |
| Subscribers | 40,000 |
| ARPU (monthly) | $60 |
| Annual revenue | ~$28.8M |
| Monthly churn | 1.5% |
| EBITDA margin | 45% |
| Network CAPEX | heavy in build years |
| Depreciation | long-lived assets |
From subscribers to EBITDA and IRR
100,000 homes passed at a 40% take rate is 40,000 subscribers, and at a $60 monthly ARPU that is roughly $28.8M of annual revenue. At a 45% EBITDA margin the network throws off about $13M of EBITDA, but the build consumed heavy CAPEX first, and depreciation on that network is one of the largest costs below EBITDA. The return therefore depends entirely on how fast take-rate climbs toward the stabilised 40% and how low churn stays, because the fixed cost is already sunk. Lift take-rate to 50% and the same network earns 25% more revenue on almost the same cost base, which is the operating leverage that makes telecom attractive once the network fills. Over a 3 to 25-year horizon the model funds the build, runs the depreciation, and produces the DCF and IRR, where the long asset life pushes value into the out-years the subscriber assumptions have to hold.
The telecom J-curve: build, fill, harvest
Telecom cash flow follows a shape every network investor knows: a deep dip before a long climb, the J-curve. In the build phase, capital pours into the network while few subscribers are connected, so cumulative cash falls hard. In the fill phase, take-rate climbs and the recurring base grows, and cash flow turns from negative to positive as revenue catches the fixed cost. In the harvest phase, the network is largely built and mostly full, CAPEX drops to maintenance, and the business throws off strong free cash flow because the heavy spending is behind it. Getting the phasing right is the whole model: build too fast ahead of demand and the trough deepens dangerously; build too slowly and a competitor passes the same homes first. The model runs all three phases explicitly, so the peak funding need in the build years is sized before the plan is committed, and the harvest-phase cash that justifies the whole investment is visible at the end.
Telecom model vs a generic financial model
| What differs | Generic model | Telecom financial model |
|---|---|---|
| Revenue driver | Price × volume | Subscribers × ARPU, net of churn |
| Growth logic | Single rate | Additions vs churn, plus take-rate |
| CAPEX | Steady spend | Front-loaded network build, then maintenance |
| Cost profile | Blended | High fixed cost, heavy depreciation |
| Where value sits | Near-term | Long-lived assets, out-year subscribers |
Subscriber, penetration and pricing data for grounding assumptions are published by the Federal Communications Commission, the standard US reference for broadband and communications markets.
Reference: Federal Communications Commission — Reports, the benchmark source for US broadband penetration and communications-market data.
How to download your telecom model (3 steps)
- Choose the Telecom / ISP template. The subscriber, ARPU, churn and network-CAPEX defaults load as editable inputs.
- Set your own homes passed, take-rate, ARPU, churn, CAPEX and depreciation life. Pick annual or quarterly periods and a 3 to 25-year horizon.
- Preview the linked statements, EBITDA, IRR and DCF, then download the Excel workbook. Up to 3 years is free with just your email; longer horizons are a one-time purchase.
Three focused variants build on the same telecom engine: the telecom cash flow forecasting model for the build-phase cash gap, the telecom DCF valuation model for enterprise value and IRR, and the telecom free cash flow model for the CAPEX-to-FCF bridge and peak funding need.
Frequently asked questions
Why do telecom models need long horizons?
Fibre and tower investments recover cost over 10–25 years; lenders require full-life DCF and coverage ratios, which the premium tier provides.
Does it model subscriber churn?
Reflect churn by using net subscriber growth in the units-growth assumption.
Can it handle heavy debt structures?
Yes — full debt schedule with tenor, grace period and interest coverage on the KPI dashboard.
What is ARPU and why does it drive a telecom model?
ARPU, average revenue per user, is recurring revenue divided by subscribers, and with a near-fixed network cost it is the lever that flows most directly to profit. Adding a subscriber to a network that is already built costs almost nothing, so ARPU growth and subscriber growth both drop heavily to EBITDA. The model keeps ARPU and subscribers separate so a plan built on more users reads differently from one built on charging each user more.
Why is telecom so capital-intensive?
Because the network has to be built before a single subscriber is served, and then kept current. Fibre, towers, spectrum and equipment absorb 15-25% of revenue in CAPEX in a build phase, and the depreciation that follows is one of the largest cost lines. That front-loaded capital is why telecom returns depend on filling the network: the fixed cost is sunk, so every extra subscriber over the break-even point is highly profitable.
What churn rate is healthy for an ISP?
Lower is always better because a subscriber lost has to be replaced before growth even begins, and reacquisition costs money. Monthly churn in the low single digits is typical for fixed broadband, higher for prepaid mobile. Because churn compounds against the base, a one-point improvement can be worth more than a marketing campaign, which is why the model tracks it as a primary driver rather than an afterthought.
Telecom across our four models
Telecom / ISP Cashflow Forecasting Model · Telecom / ISP DCF Valuation Model · Telecom / ISP Free Cashflow Model
More industry financial models
SaaS / Subscription financial model · Data Center financial model · Real Estate financial model · Manufacturing financial model · Hotel / Hospitality financial model · E-commerce / Retail financial model · Healthcare / Clinic financial model · Fintech / Lending financial model · Energy / Solar financial model · Early-Stage Startup financial model · Restaurant / F&B financial model · Professional Services financial model · Logistics / Transport financial model · Education / Training financial model · Construction financial model · Media / Content financial model · Agriculture financial model · Pharma / Distribution financial model · Fitness / Wellness financial model · Nonprofit / NGO financial model · Pricing
Free tools
WACC calculator · CAPM calculator · DCF calculator · IRR calculator · Inside the 16-sheet model · Glossary