Real Estate Financial Model in Excel (Free Pro Forma Download)
A real estate financial model (pro forma) projects unit sales and rental income against land and construction CAPEX, development debt and operating costs, producing levered cash flows, IRR and a DCF valuation. Generate a 16-sheet linked Excel pro forma free for up to 3 years, or up to 25 years with premium.
⚡ Generate my Real Estate model — free (requires JavaScript)
The fastest way to an investor-ready real estate financial model is a template pre-loaded with the industry's real revenue drivers and cost structure. This generator builds a 16-sheet, fully formula-linked Excel workbook — three statements, DCF & IRR — around real estate-specific assumptions in about five minutes. Free up to 3 years, just your email.
Key drivers pre-loaded in this template
| Units × average selling price | Development sales revenue |
| Rental income stream | Recurring income with escalation |
| $8M CAPEX, $6M debt defaults | Development-scale financing structure |
| WACC ~10%, EV/EBITDA ~14x | Property-sector valuation defaults |
What you get
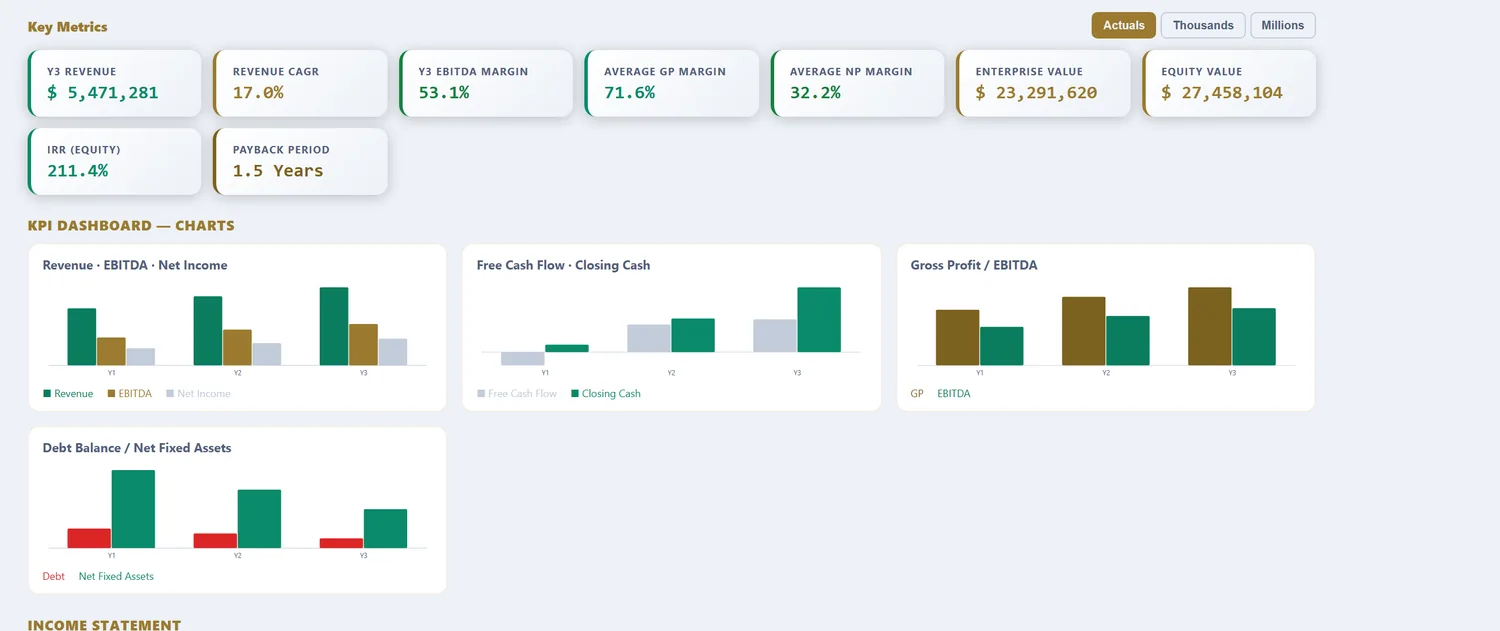
A 16-sheet, fully formula-linked Excel workbook: Assumptions, Revenue, OPEX, CAPEX & Depreciation, Debt, Tax (with loss carryforward), Income Statement, Cash Flow, Balance Sheet, DCF Valuation, Sensitivity tables, a charted KPI Dashboard, a Scenarios sheet (Base, Best & Worst), and an Integrity Check. Free 16-sheet linked Excel download for models up to 3 years (annual or quarterly, just your email). Models from 5 to 25 years are $29.98 per model download.
What's inside the 16-sheet real estate pro forma
The download is one Excel workbook with 16 formula-linked sheets: assumptions, revenue, operating costs, CAPEX and depreciation, a debt schedule, tax with loss carryforward, the three financial statements, a DCF valuation, sensitivity tables, a KPI dashboard, a Base/Best/Worst scenarios sheet and an automated error check. For property work, three of those sheets carry most of the weight — the revenue build, the CAPEX schedule and the debt sheet — so here is what each one does with real-estate numbers in it.
Property type sets the whole model
Before any numbers, the asset class decides the revenue logic and the horizon. A build-to-sell development is a different financial animal from a rental hold, and a generic pro forma serves neither well.
| Type | Revenue basis | Horizon | Modelling focus |
|---|---|---|---|
| Development (build-to-sell) | Unit sales × price, by absorption | Build + sell-out | GDV, construction debt, levered IRR |
| Residential rental | Rent roll, vacancy, escalation | 10-25 yr hold | NOI, cap rate, DSCR |
| Commercial / office | Lease income, tenant terms | Long hold | Lease rollover, NOI, exit cap rate |
| Mixed-use | Sales plus rental streams | Blended | Both routes in one workbook |
Development revenue: units × price with absorption
Development sales are modelled as units × average selling price. Forty units at $250,000 is a $10.0M gross development value (GDV), but no serious model books it in one month. An absorption assumption spreads the sales across the delivery period, and pre-sales can pull deposits forward. The timing matters more than the total: the same GDV landing six months later can turn a comfortable financing plan into a covenant problem.
Rental income with escalation and vacancy
The recurring stream is a rent roll: units or square footage × rent, trimmed by a vacancy rate and grown by an annual escalation. What remains after operating costs is net operating income (NOI) — the number a cap rate is applied to at exit, and the base for debt service coverage while you hold. The model keeps sales and rental income as separate streams so a mixed development reads clearly.
Construction CAPEX and the debt drawdown
The template loads development-scale defaults: $8M of land and construction CAPEX funded by $6M of development debt — a 75% loan-to-cost ratio, which is at the aggressive end of what senior lenders offer. The drawdown follows the build schedule rather than arriving day one, interest accrues only on the drawn balance, and repayment comes from unit sales. Equity fills the gap, and the model shows exactly when it is needed.
Worked example: a 40-unit development, in numbers
| Input | Value |
|---|---|
| Land acquisition | $2.0M |
| Hard + soft construction costs | $6.0M |
| Units | 40 |
| Average selling price | $250,000 |
| Gross development value (GDV) | $10.0M |
| Development debt (75% LTC) | $6.0M at 9% |
| Equity required | $2.0M |
| Build + sell-out period | ~30 months |
From GDV to levered IRR
Total cost is $8.0M. Against a $10.0M GDV that leaves $2.0M of gross margin, and roughly $0.5M of it goes to construction-period interest, so net profit is about $1.5M. The equity investor put in $2.0M and gets back $3.5M — a 1.75x equity multiple over two and a half years, which works out to a levered IRR in the mid-twenties. That clears the 15–20% hurdle developers typically demand for construction risk. For context, stabilised income property returns average in the high single digits over the long run, per the NCREIF Property Index — development earns its premium by taking risks a stabilised asset has already retired.
Source for long-run stabilised returns: the NCREIF Property Index, the standard US benchmark for unlevered institutional property performance.
Why the interest reserve matters
During construction there is no income, but interest on the drawn debt is due every month. Lenders fund it from an interest reserve inside the facility — which is why the loan balance grows before a single unit sells. Models that skip the reserve show cash the project never has, and the error compounds: understated debt at completion means overstated profit at exit. The debt sheet in this model accrues interest on the drawn balance automatically.
Holding instead of selling: the stabilised exit
Not every project sells out. If the plan is to hold the units as rentals, the model shifts from GDV to a stabilised valuation: NOI divided by an exit cap rate. Suppose 20 of the 40 units are retained, renting at $1,500 a month with 5% vacancy and 3% annual escalation — roughly $342,000 of NOI after operating costs. At a 6% exit cap rate that block is worth about $5.7M, and a refinance at 65% loan-to-value releases $3.7M of the equity while the rent covers the new debt service. The pro forma models both routes in the same workbook, so you can compare sell-everything against build-to-rent on identical assumptions rather than on instinct. Over a 10 to 25-year hold, the escalation compounding band by band is what keeps the later years honest.
The four assumptions that decide real estate returns
A property model has many inputs, but four move the answer more than all the rest combined.
| Assumption | Typical range | Why it dominates |
|---|---|---|
| Exit cap rate | 5-8% | Sets the sale value off stabilised NOI; the largest swing |
| Loan-to-cost / loan-to-value | 60-75% | Sizes the debt and therefore the levered return |
| Rent growth / escalation | 2-4% per year | Compounds NOI across a long hold |
| Construction cost & contingency | + 5-10% buffer | Overruns come straight off the development margin |
The exit cap rate is the single biggest lever in a hold: a shift from 6% to 6.5% on the same NOI cuts the sale value by roughly 8%, and because the sale is where most of the return sits, that flows almost directly to IRR. Leverage sizes the debt and magnifies the equity return in both directions. Rent escalation looks small at a couple of points but compounds over a ten to twenty-five year hold. And construction cost is where development margin quietly disappears, which is why a contingency line belongs in every build budget.
Cap rate and DSCR: the two numbers lenders check
Once a property stabilises, two ratios govern it. The cap rate values it: NOI divided by the cap rate gives the asset value, and the same cap rate applied at exit derives the sale price. The debt service coverage ratio finances it: NOI divided by annual debt service, where senior lenders typically require about 1.20 to 1.25x, meaning income must clear debt service by a fifth. The model computes both every period, so a hold that looks healthy on profit but fails coverage in a soft year shows the problem before a lender finds it. Bank underwriting standards for commercial property move with the cycle and are tracked publicly in the Federal Reserve's Senior Loan Officer Opinion Survey.
Reference: the Federal Reserve Senior Loan Officer Opinion Survey for quarterly changes in commercial real estate lending standards.
Real estate pro forma vs a generic financial model
| What differs | Generic model | Real estate pro forma |
|---|---|---|
| Revenue drivers | Price × volume | Units × price with absorption, plus rent roll with vacancy |
| CAPEX shape | Steady annual spend | Front-loaded land + construction drawdown |
| Debt structure | Simple term loan | LTC-sized facility, interest reserve, repayment from sales |
| Valuation | DCF on operating cash flow | DCF plus NOI × exit cap rate cross-check |
| Horizon | 3–5 years | Build period plus hold — often 10–25 years |
How to download your real estate model (3 steps)
- Choose the Real Estate template — the drivers above load as editable defaults.
- Set your own units, prices, rent roll, CAPEX and debt terms; pick annual or quarterly periods and a 3 to 25-year horizon.
- Preview the linked statements and download the Excel workbook. Up to 3 years is free with just your email; longer horizons are a one-time purchase.
Modelling the cash timing specifically? The real estate free cash flow model tracks the same project from NOPAT to levered FCF with peak funding need. And the cash forecasting methods guide explains the machinery behind it.
Frequently asked questions
How long should a real estate model run?
Development deals often model 5–10 years; income-producing or leased assets typically 10–25 years to match hold periods and loan terms — supported by the premium tier.
Does it calculate levered IRR?
Yes — equity IRR is computed on cash flows after debt service using a Newton-Raphson solver, live in Excel.
Can I model both sales and rental income?
Yes — up to three independent revenue streams, e.g. unit sales plus rental income with separate growth assumptions.
How do I build a real estate pro forma in Excel?
Start with a unit schedule (units × price, spread by absorption), add a rent roll with escalation and vacancy, then layer land and construction CAPEX, the debt drawdown with interest, and tax. Link the three statements and discount levered cash flows for IRR. Or download one pre-built, free.
What is a good IRR for a real estate development?
Development deals typically target a 15–20%+ levered IRR to compensate for construction and lease-up risk. Stabilised rental assets accept less — usually 8–12% levered — because the income is already in place. Below those ranges, most investors prefer to wait for a better basis.
What is a cap rate and how does it value a property?
A capitalisation rate is net operating income divided by value, so a property earning $600,000 of NOI at a 6% cap rate is worth about $10M. Lower cap rates mean higher values and usually safer, prime assets; higher cap rates price in more risk. At exit, the model applies your cap rate to stabilised NOI to derive the sale value, which is where most of a hold's return is realised.
Real Estate across our four models
Real Estate Cashflow Forecasting Model · Real Estate DCF Valuation Model · Real Estate Free Cashflow Model
More industry financial models
SaaS / Subscription financial model · Data Center financial model · Manufacturing financial model · Hotel / Hospitality financial model · E-commerce / Retail financial model · Healthcare / Clinic financial model · Fintech / Lending financial model · Energy / Solar financial model · Early-Stage Startup financial model · Restaurant / F&B financial model · Professional Services financial model · Logistics / Transport financial model · Education / Training financial model · Construction financial model · Media / Content financial model · Telecom / ISP financial model · Agriculture financial model · Pharma / Distribution financial model · Fitness / Wellness financial model · Nonprofit / NGO financial model · Pricing
Free tools
WACC calculator · CAPM calculator · DCF calculator · IRR calculator · Inside the 16-sheet model · Glossary