Professional Services Financial Model in Excel (Free Consulting Download)
A professional-services financial model projects fee revenue from billable hours × rates plus retainers, against a payroll-heavy cost base near 45% of revenue, producing linked statements with cash flow and valuation. Generate the full 16-sheet Excel model free for up to 3 years.
⚡ Generate my Professional Services model — free (requires JavaScript)
The fastest way to an investor-ready professional services financial model is a template pre-loaded with the industry's real revenue drivers and cost structure. This generator builds a 16-sheet, fully formula-linked Excel workbook — three statements, DCF & IRR — around professional services-specific assumptions in about five minutes. Free up to 3 years, just your email.
Key drivers pre-loaded in this template
| Billable hours × rate | Utilization-driven fee revenue |
| Retainer stream | Recurring contracted income |
| Payroll ~45% of revenue | People-cost-dominated structure |
| Low CAPEX | Asset-light services profile |
What you get
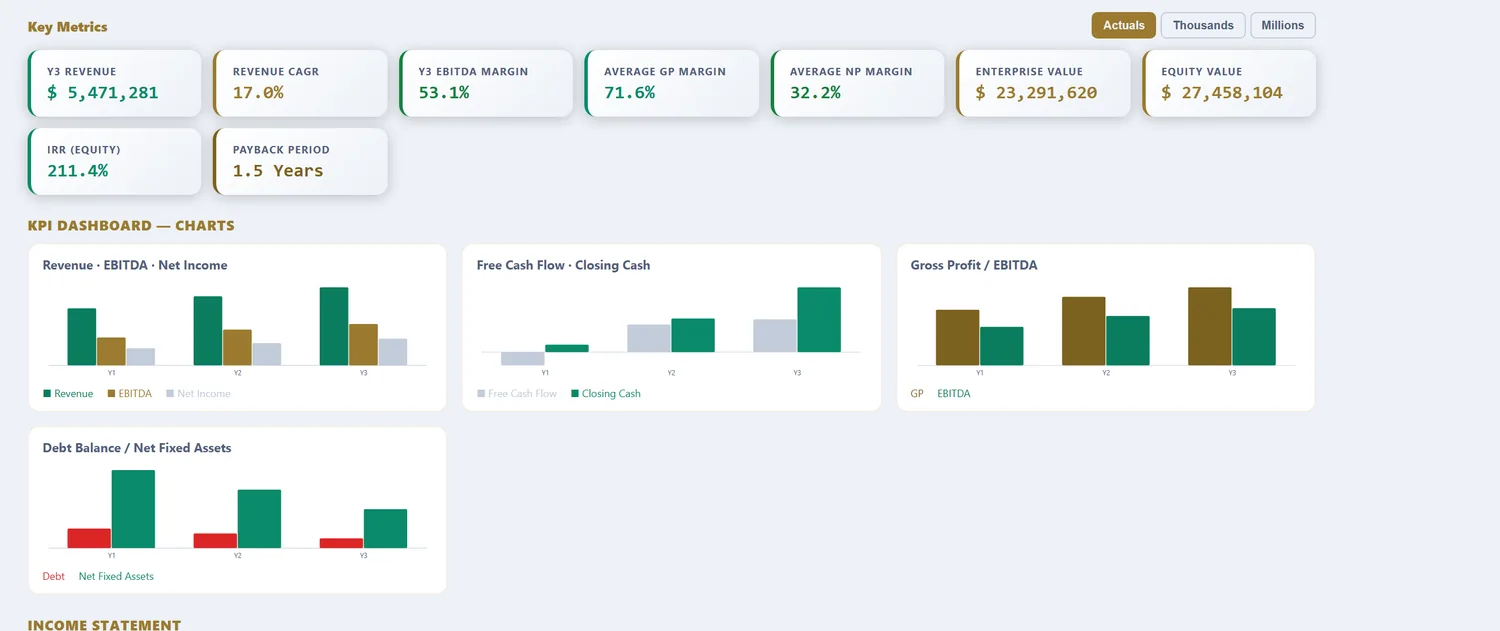
A 16-sheet, fully formula-linked Excel workbook: Assumptions, Revenue, OPEX, CAPEX & Depreciation, Debt, Tax (with loss carryforward), Income Statement, Cash Flow, Balance Sheet, DCF Valuation, Sensitivity tables, a charted KPI Dashboard, a Scenarios sheet (Base, Best & Worst), and an Integrity Check. Free 16-sheet linked Excel download for models up to 3 years (annual or quarterly, just your email). Models from 5 to 25 years are $29.98 per model download.
What a professional-services financial model computes
A consultancy or agency sells time, and the model exists to show how profitably that time is sold. Revenue is billable hours multiplied by rate, softened by realization and topped up with retainers, and the cost base is overwhelmingly people. Three levers decide the outcome: utilization, how much of each person's time is billed; realization, how much of the rate card is actually collected; and leverage, the ratio of junior to senior staff that sets the margin per senior. A generic template collapses all three into a revenue-per-head number and misses exactly the mechanics a services firm is managed by.
The template loads services-scale defaults: fee revenue from billable hours and rates plus retainers, staff cost as the dominant line, and the utilization and realization drivers that move it. What follows is what each part does with real professional-services numbers in it.
Firm types change the model
Before any numbers, the firm type sets the revenue rhythm and the leverage.
| Type | Revenue basis | Leverage | Modelling focus |
|---|---|---|---|
| Management consulting | High rates, project-based | High pyramid | Utilization, leverage, rate |
| Creative / agency | Retainers + projects | Moderate | Retainer stability, project mix |
| Legal / accounting | Billable hours, partners | Grade-heavy | Realization, partner leverage |
| Boutique / specialist | Premium rates, low volume | Flat | Rate, senior utilization |
A management consultancy runs a steep pyramid and lives on utilization and leverage. An agency leans on retainers for revenue stability with project work on top, so the retainer base matters as much as the rate. Legal and accounting firms bill by the hour across grades and watch realization closely. A boutique earns premium rates on scarce senior time, so its whole model is senior utilization at a high rate rather than leverage. The template keeps grades and revenue types explicit because the profit engine differs sharply across them.
The three levers: utilization, realization, leverage
Almost all of a services firm's profit is set by three ratios.
| Lever | Definition | Typical |
|---|---|---|
| Utilization | Billable ÷ available hours | 65-80% |
| Realization | Collected ÷ standard rate | 80-95% |
| Leverage | Junior : senior staff | Firm-dependent |
Utilization is the master lever because the salary is fixed regardless of whether the hours sell, so every point of utilization drops heavily to margin. Realization protects the rate: a firm that discounts hard or writes off overruns can be busy and still thin. Leverage multiplies the effect, because a wider base of billable juniors under each senior lifts the margin per partner. The model computes all three so a plan built on charging more reads differently from one built on billing more of the team's time, or on delivering with a leaner pyramid.
The four assumptions that decide services returns
| Assumption | Typical range | Why it dominates |
|---|---|---|
| Utilization | 65-80% | Sells a fixed salary base |
| Effective rate (× realization) | Rate card × 80-95% | Revenue per billed hour |
| Leverage ratio | Firm-dependent | Margin per senior |
| Headcount growth vs pipeline | Matched carefully | Bench cost if mismatched |
Utilization sells the fixed cost of the team. The effective rate, the rate card after realization, sets what each billed hour is worth. Leverage sets how much margin each senior generates through the juniors beneath them. And headcount growth has to track the pipeline, because hiring ahead of demand puts expensive people on the bench while hiring behind it caps growth and burns out the team. The model runs all four so a growth plan is judged on utilization and margin, not just on headcount.
Worked example: a consulting firm, in numbers
| Input | Value |
|---|---|
| Billable staff | 40 |
| Available hours / yr | 1,800 each |
| Utilization | 72% |
| Billable hours | ~51,840 |
| Rate card | $220/hr |
| Realization | 88% |
| Effective rate | ~$194/hr |
| Fee revenue | ~$10.0M |
| Staff cost | ~55% of revenue |
From hours to margin and IRR
40 billable staff at 1,800 available hours and 72% utilization sell about 51,840 billable hours a year, and at a $220 rate card realised at 88%, roughly $194 an hour, that is close to $10.0M of fee revenue. Staff cost at about 55% is the anchor, and after support cost and overhead the operating margin for a healthy firm lands in the high teens to low twenties. The sensitivity is all in the three levers: lift utilization four points and revenue rises with almost no extra cost, protect realization and the rate holds, widen leverage and the margin per senior grows. Drop utilization to 65% in a soft quarter and the fixed salaries no longer cover themselves. Over a 3 to 25-year horizon the model runs that dynamic, and because a services firm is light on assets, the DCF turns on the durability of utilization and rates rather than on capital, which is where the sensitivity tables do their work. Scaling a services firm is fundamentally a hiring problem, because growth means recruiting, training and utilising more people without letting utilization slip or realization erode, and the model ties headcount to the pipeline so that expansion is planned against demand rather than hope.
The cash gap: work in progress and collection
A services firm does the work now and collects later, and the gap in between is a real call on cash that a profit forecast hides. Time is spent and salaries are paid as consultants deliver, but the client is invoiced on a milestone or month-end and then pays on 30 to 60 day terms, so unbilled work in progress and receivables tie up cash continuously. Growth widens the gap: a firm scaling headcount and projects funds more delivered-but-unpaid work before the cash arrives, which is why a profitable, fast-growing consultancy can still be tight on cash. Disputed time and write-offs make it worse, because work that is never billed is salary spent for nothing. The model tracks billing against delivery so the working-capital need is visible, and so a growth plan is judged on the cash it consumes as well as the fees it books. On the worked example, a month of unbilled work in progress plus 45-day receivables can tie up well over a million dollars at any moment, cash that grows with the firm and has to be funded before the fees arrive.
Professional-services model vs a generic financial model
| What differs | Generic model | Professional-services model |
|---|---|---|
| Revenue driver | Price × volume | Billable hours × effective rate + retainers |
| Capacity | Ignored | Utilization of a fixed salary base |
| Rate | Rate card | Realization-adjusted effective rate |
| Cost logic | Blended | Staff by grade, leverage pyramid |
| Key risk | Margin | Utilization and the bench |
Utilization and realization are disclosed by listed professional-services firms in their filings, readable through the SEC's EDGAR database, the primary source for audited services-firm metrics.
Reference: SEC EDGAR full-text search, where listed consultancies disclose utilization, rates and revenue per head in audited filings.
How to download your professional-services model (3 steps)
- Choose the Professional Services template. The billable-hours, rate, utilization and staff defaults load as editable inputs.
- Set your own utilization, rate card, realization, leverage and headcount plan. Pick annual or quarterly periods and a 3 to 25-year horizon.
- Preview the linked statements, margin and IRR, then download the Excel workbook. Up to 3 years is free with just your email; longer horizons are a one-time purchase.
Three focused variants build on the same services engine: the professional-services cash flow model for the billing cash gap, the professional-services DCF valuation model for enterprise value and IRR, and the professional-services free cash flow model for the cash bridge.
Frequently asked questions
How do I model utilization?
Drive revenue as units × price — units representing billable hours and price the blended rate.
What margin is typical for services firms?
Well-run consultancies target 15–25% EBITDA margins; the linked statements show yours instantly.
Is 5 years enough?
Yes for most partnerships and agencies — the free tier covers it fully.
What is utilization and why does it drive a services firm?
Utilization is billable hours divided by available hours, the share of a consultant's time that is sold. Because staff salaries are fixed whether or not the hours are billed, utilization is the single biggest driver of profit in a services firm: the difference between 65% and 80% utilization on the same team can double the margin. The model keeps utilization explicit rather than assuming a smooth revenue-per-head figure.
What is realization and how does it differ from the rate card?
Realization is the rate actually collected divided by the standard rate card, and it is almost always below 100%. Discounts, write-offs, fixed-fee overruns and unbilled time all erode the headline rate, so a firm quoting $300 an hour might realise $240. Modelling on the rate card overstates revenue; the model applies a realization factor so the fee income reflects what is actually collected.
What is leverage in a consulting model?
Leverage is the ratio of junior to senior staff, the shape of the delivery pyramid. A firm that delivers with many juniors under each senior earns more margin per partner, because junior time is billed above its cost while senior time is scarce and expensive. The model treats grades separately so the leverage ratio, and the margin it produces, is visible rather than buried in an average cost per head.
Professional Services across our four models
Professional Services Cashflow Forecasting Model · Professional Services DCF Valuation Model · Professional Services Free Cashflow Model
More industry financial models
SaaS / Subscription financial model · Data Center financial model · Real Estate financial model · Manufacturing financial model · Hotel / Hospitality financial model · E-commerce / Retail financial model · Healthcare / Clinic financial model · Fintech / Lending financial model · Energy / Solar financial model · Early-Stage Startup financial model · Restaurant / F&B financial model · Logistics / Transport financial model · Education / Training financial model · Construction financial model · Media / Content financial model · Telecom / ISP financial model · Agriculture financial model · Pharma / Distribution financial model · Fitness / Wellness financial model · Nonprofit / NGO financial model · Pricing
Free tools
WACC calculator · CAPM calculator · DCF calculator · IRR calculator · Inside the 16-sheet model · Glossary