Media Financial Model in Excel (Free Content & Advertising Download)
A media or content financial model projects advertising revenue (audience × CPM) and subscription income against content-production costs near 30% of revenue and marketing spend, producing linked statements with valuation. Generate the full 16-sheet Excel model free for up to 3 years.
⚡ Generate my Media / Content model — free (requires JavaScript)
The fastest way to an investor-ready media / content financial model is a template pre-loaded with the industry's real revenue drivers and cost structure. This generator builds a 16-sheet, fully formula-linked Excel workbook — three statements, DCF & IRR — around media / content-specific assumptions in about five minutes. Free up to 3 years, just your email.
Key drivers pre-loaded in this template
| Audience × CPM | Advertising revenue engine |
| Subscription stream | Recurring reader/viewer revenue, 45% growth default |
| Content costs ~30% | Production and talent cost base |
| WACC ~14% | Hit-driven-sector discount rate |
What you get
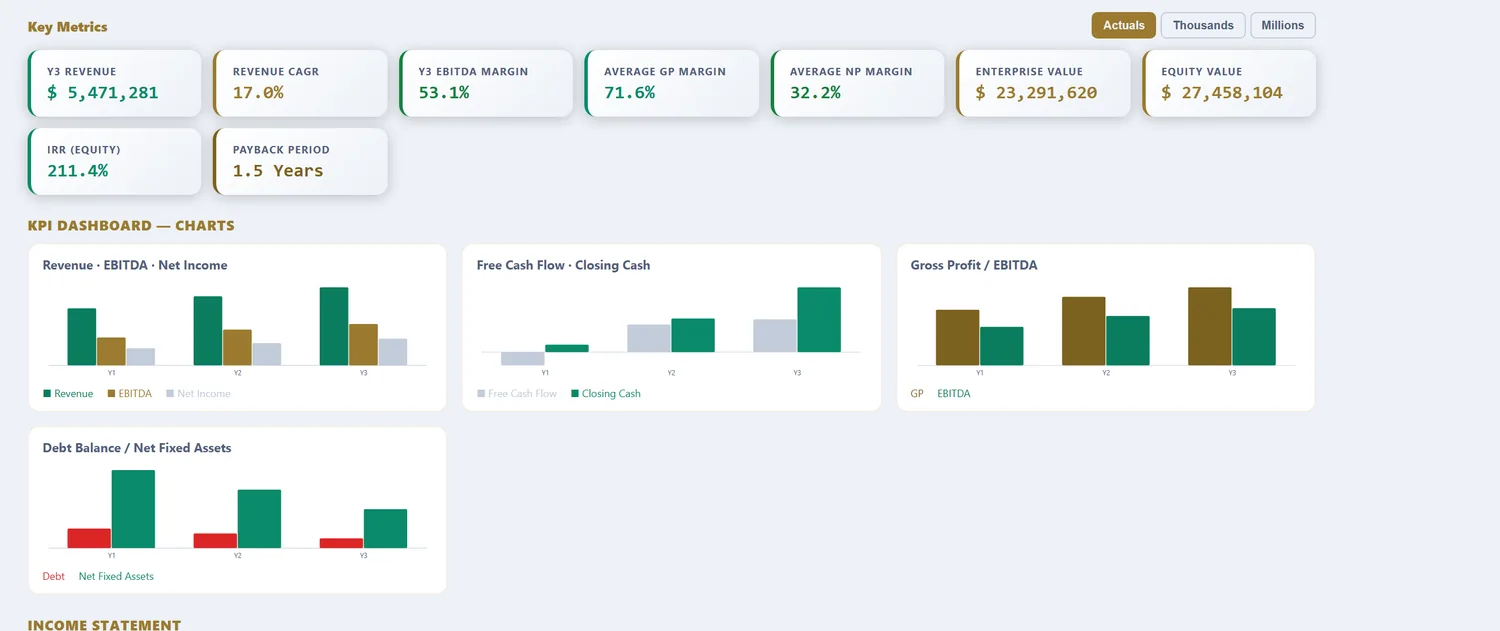
A 16-sheet, fully formula-linked Excel workbook: Assumptions, Revenue, OPEX, CAPEX & Depreciation, Debt, Tax (with loss carryforward), Income Statement, Cash Flow, Balance Sheet, DCF Valuation, Sensitivity tables, a charted KPI Dashboard, a Scenarios sheet (Base, Best & Worst), and an Integrity Check. Free 16-sheet linked Excel download for models up to 3 years (annual or quarterly, just your email). Models from 5 to 25 years are $29.98 per model download.
What a media financial model computes
A media or content business makes something once and sells access to it many times, and the model exists to show whether the audience is large enough to cover the content. Revenue comes from two engines: advertising, which is audience multiplied by CPM, and subscription, which is subscribers multiplied by a fee net of churn. The dominant cost is content, largely fixed, made once and distributed at almost no marginal cost. The economic logic is spreading that fixed content cost across the widest possible audience. A generic template blends the two revenue engines and misses both the cyclical nature of advertising and the operating leverage of content.
The template loads media-scale defaults: advertising revenue from audience and CPM alongside subscription income, content cost as the dominant fixed line, and the churn that erodes the subscriber base. What follows is what each part does with real media numbers in it.
Revenue models change everything
Before any numbers, the revenue mix sets the risk profile and the cost logic.
| Model | Revenue basis | Risk | Modelling focus |
|---|---|---|---|
| Ad-supported | Audience × CPM | Cyclical ad market | Reach, engagement, CPM |
| Subscription | Subscribers × fee | Churn, content quality | ARPU, churn, retention |
| Hybrid | Ads + subscription | Balanced | Mix, tiering, conversion |
| Licensing / syndication | Content sold to others | Deal-dependent | Catalogue value, contracts |
An ad-supported model scales with audience but rides the ad-market cycle, so a downturn cuts revenue with no change in audience. Subscription is steadier and higher-margin per user but demands content worth paying for and relentless churn management. Hybrid models blend the two, often using free ad-supported content to convert to paid. Licensing sells the catalogue to other distributors. The model keeps the revenue engines separate because their risks are different and blending them hides which one is actually carrying the business.
The revenue engines: CPM and subscription
Media revenue is two very different machines, and the model builds each on its own drivers.
| Engine | Driver | Note |
|---|---|---|
| Advertising | Impressions × CPM | Cyclical; priced by the ad market |
| Subscription | Subscribers × ARPU | Recurring; eroded by churn |
| Engagement | Time / frequency | Lifts both impressions and retention |
Advertising turns on reach and engagement feeding impressions, priced at a CPM the ad market sets, so it is powerful in a boom and brutal in a downturn. Subscription turns on ARPU and churn, more predictable but capped by how many people will pay. Engagement sits underneath both, because time spent lifts impressions for advertisers and reduces churn for subscribers at the same time. The model keeps the engines separate so a plan leaning on ad growth reads differently from one building a subscription base.
The four assumptions that decide media returns
| Assumption | Typical range | Why it dominates |
|---|---|---|
| Audience / reach | Growth-dependent | Feeds ad impressions |
| CPM | Market and format | Ad revenue per impression |
| Subscriber churn | Lower is better | Erodes the recurring base |
| Content cost ratio | Share of revenue | The fixed cost to spread |
Audience feeds the impressions advertisers pay for and the pool that subscription converts from. CPM sets what each impression is worth and swings with the ad cycle. Churn erodes the subscriber base and, like all recurring revenue, compounds against you. And the content cost ratio is the fixed cost that scale has to spread, because content made once earns more the wider it is distributed. The model runs all four so operating leverage, the whole promise of media, is visible as audience grows.
Worked example: a digital media business, in numbers
| Input | Value |
|---|---|
| Monthly impressions | 20M |
| CPM | $15 |
| Ad revenue / yr | ~$3.6M |
| Subscribers | 25,000 |
| Subscription ARPU | $8/mo |
| Subscription revenue / yr | $2.4M |
| Monthly churn | 3% |
| Content cost | 40% of revenue |
From audience to margin and IRR
20 million monthly impressions at a $15 CPM is about $3.6M of annual advertising revenue, and 25,000 subscribers at $8 a month adds $2.4M, for $6.0M total across the two engines. Content cost at 40% is the dominant fixed line, so the operating leverage is real: grow audience and subscribers against that largely fixed content cost and margin expands quickly, because the content is already made. The risk is the mix, since a cyclical downturn can cut the $3.6M ad line hard while the subscription base holds, which is exactly why a business over-indexed on advertising is worth less than a balanced one. Manage churn down and the subscription base compounds; let it drift and the paid revenue leaks. Over a 3 to 25-year horizon the model runs both engines, spreads the content cost across a growing audience, and produces the DCF and IRR, where audience durability and churn decide whether the business compounds. Because so much of a media business's worth sits in the future audience the content is meant to build, the DCF is dominated by the out-years, and the discount rate and the churn assumption carry more weight than the current year's advertising number ever does.
Content investment and the audience flywheel
The hardest judgment in a media model is how much to spend on content, because content is the fixed cost that both drives the audience and consumes the cash. Spend more and better content can grow reach and cut churn, feeding both revenue engines; spend too much and the audience never covers it. That is the flywheel media businesses chase: content attracts audience, audience funds more content, and the loop compounds when it works and drains cash when it does not. Streaming and subscription media in particular front-load enormous content investment against a subscriber base that has to grow into it, so the free cash flow line can stay negative for years while the library and the audience build. The model keeps content spend as an explicit investment against audience and churn, so the point where the flywheel turns cash-positive is visible, and a plan that is simply outspending its audience is exposed before it runs out of road. On the worked example, lifting content spend above 40% of revenue to chase reach only pays back if the added audience and lower churn actually materialise, which is precisely the bet the sensitivity tables let an investor stress rather than take on faith.
Media model vs a generic financial model
| What differs | Generic model | Media financial model |
|---|---|---|
| Revenue driver | Price × volume | Audience × CPM, plus subscribers × ARPU |
| Revenue risk | Single stream | Cyclical ads vs recurring subscription |
| Cost logic | Blended | Content as fixed cost, spread by scale |
| Operating leverage | Linear | High: fixed content across a growing audience |
| Key metric | Margin | Reach, CPM, churn, content ratio |
Digital advertising spend and CPM trends for grounding ad-revenue assumptions are published by the Interactive Advertising Bureau, the standard reference for the US digital ad market.
Reference: Interactive Advertising Bureau (IAB) — Insights, the benchmark source for US digital advertising spend and CPM trends.
How to download your media model (3 steps)
- Choose the Media / Content template. The audience, CPM, subscription and content-cost defaults load as editable inputs.
- Set your own reach, CPM, subscriber base, churn and content cost. Pick annual or quarterly periods and a 3 to 25-year horizon.
- Preview the linked statements, margin and IRR, then download the Excel workbook. Up to 3 years is free with just your email; longer horizons are a one-time purchase.
Three focused variants build on the same media engine: the media cash flow forecasting model for content-investment cash, the media DCF valuation model for enterprise value and IRR, and the media free cash flow model for the cash bridge.
Frequently asked questions
Can I mix ad and subscription revenue?
Yes — they are the template's two default streams, each with independent growth and inflation.
How do I model a creator business?
Use ad revenue for platform income and the second stream for sponsorships, memberships or courses.
Is 5 years enough for a media plan?
Yes for most media ventures and fundraises — covered by the free tier.
How does advertising revenue work in a media model?
Advertising revenue is audience multiplied by the rate advertisers pay, usually expressed as CPM, the price per thousand impressions. A site serving 10 million impressions a month at a $15 CPM earns $150,000. It scales with reach and engagement but is cyclical and priced by the ad market, so the model keeps audience and CPM separate to stress each independently rather than assuming one blended ad number.
Is subscription or advertising a better media model?
They carry different risks. Advertising scales with audience but is volatile and priced by a cyclical ad market you do not control. Subscription is more predictable and higher-margin per user but demands content good enough to pay for and constant churn management. Many media businesses run both, and the model keeps them as separate streams so the stability of subscription and the upside of advertising can be weighed rather than blended.
What is the biggest cost in a media business?
Content. Whether produced in-house or licensed, content is the dominant and often fixed cost, made once and then distributed to as many people as possible. That is the whole economic logic of media: high fixed content cost spread across a large audience, so the marginal cost of one more reader or viewer is near zero. The model separates content cost from distribution so the operating leverage of scale is visible.
Media across our four models
Media / Content Cashflow Forecasting Model · Media / Content DCF Valuation Model · Media / Content Free Cashflow Model
More industry financial models
SaaS / Subscription financial model · Data Center financial model · Real Estate financial model · Manufacturing financial model · Hotel / Hospitality financial model · E-commerce / Retail financial model · Healthcare / Clinic financial model · Fintech / Lending financial model · Energy / Solar financial model · Early-Stage Startup financial model · Restaurant / F&B financial model · Professional Services financial model · Logistics / Transport financial model · Education / Training financial model · Construction financial model · Telecom / ISP financial model · Agriculture financial model · Pharma / Distribution financial model · Fitness / Wellness financial model · Nonprofit / NGO financial model · Pricing
Free tools
WACC calculator · CAPM calculator · DCF calculator · IRR calculator · Inside the 16-sheet model · Glossary