Startup Financial Model in Excel (Free Investor-Ready Download)
A startup financial model shows investors your revenue ramp, cost base, burn rate and runway in a linked three-statement format, with losses carried forward and equity funding on the balance sheet. Generate an investor-ready 16-sheet Excel model free for up to 3 years — just your email.
⚡ Generate my Early-Stage Startup model — free (requires JavaScript)
The fastest way to an investor-ready early-stage startup financial model is a template pre-loaded with the industry's real revenue drivers and cost structure. This generator builds a 16-sheet, fully formula-linked Excel workbook — three statements, DCF & IRR — around early-stage startup-specific assumptions in about five minutes. Free up to 3 years, just your email.
Key drivers pre-loaded in this template
| Aggressive revenue ramp | 100% early growth defaults, tapering |
| Pre-profit losses & NOL | Tax-loss carryforward modelled automatically |
| Equity + convertible funding | $1M equity default, editable rounds |
| WACC ~22% | Venture-stage risk-adjusted discount rate |
What you get
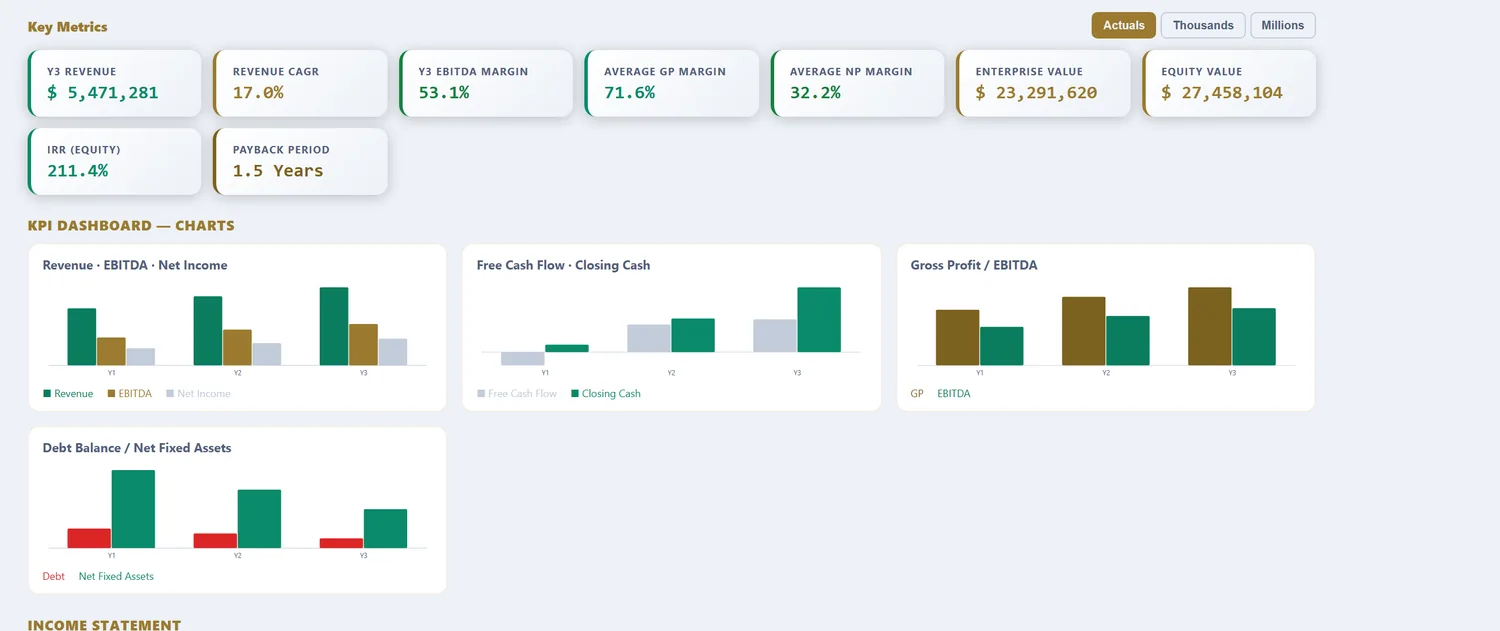
A 16-sheet, fully formula-linked Excel workbook: Assumptions, Revenue, OPEX, CAPEX & Depreciation, Debt, Tax (with loss carryforward), Income Statement, Cash Flow, Balance Sheet, DCF Valuation, Sensitivity tables, a charted KPI Dashboard, a Scenarios sheet (Base, Best & Worst), and an Integrity Check. Free 16-sheet linked Excel download for models up to 3 years (annual or quarterly, just your email). Models from 5 to 25 years are $29.98 per model download.
What a startup financial model computes
A startup model is a story told in numbers, and its job is to make the story testable rather than convincing. Revenue starts small and ramps, costs are committed ahead of it, and the gap between the two is burn, which the cash balance has to survive. Around that sit the unit economics that decide whether growth is worth funding, and the funding rounds that keep the lights on while the business proves itself. A generic template treats a startup like a mature company with a growth rate, and misses the two things investors actually scrutinise: the runway to the next milestone and whether the economics improve as the business scales.
The template loads early-stage defaults: an aggressive but tapering revenue ramp, pre-profit losses carried forward for tax, and equity or convertible funding. What follows is what each part does with real startup numbers in it.
Stage changes what the model has to prove
Before any numbers, the stage sets what the model is for, because a pre-seed idea and a Series B scale-up are answering different questions.
| Stage | Core question | Focus | Horizon |
|---|---|---|---|
| Pre-seed / seed | Can this work at all? | Ramp credibility, runway | 18-36 months |
| Series A | Do the unit economics hold? | CAC, retention, gross margin | 3-5 years |
| Series B+ | Does it scale profitably? | Efficiency, path to breakeven | 5-7 years |
Early on, the model exists to show a believable path and enough runway to reach the next proof point, so precision matters less than defensible drivers. By Series A the question is whether the unit economics actually work, so acquisition cost, retention and margin move to the centre. By Series B and beyond the model has to show the business scales toward profit rather than just burning faster. The template keeps the same engine across all three, but the number that matters shifts from runway to unit economics to efficiency.
Burn, runway and the milestone clock
The single most important discipline in a startup model is tying cash to milestones.
| Metric | Definition | Why it matters |
|---|---|---|
| Gross burn | Total monthly cash out | The spending rate |
| Net burn | Cash out minus cash in | The true consumption |
| Runway | Cash ÷ net burn | Months to zero |
| Milestone cost | Cash to next proof point | What the round must fund |
Runway is the clock every startup runs against, and the model's job is to make sure the cash lasts long enough to hit the milestone that unlocks the next raise. A round should fund a clear proof point with a buffer, not just extend the runway blindly, because raising into a milestone earns a higher valuation while raising into thin air invites a down round. The model ties spend to the milestone so a plan can be judged on whether the money buys the proof it needs.
The four assumptions that decide startup outcomes
| Assumption | Typical range | Why it dominates |
|---|---|---|
| Revenue ramp | Aggressive, tapering | The story, and the riskiest input |
| Gross margin | Model-dependent | Whether growth funds itself |
| CAC & payback | Judged on LTV | Whether acquisition scales |
| Burn / runway | Cash to milestone | Survival to the next raise |
The ramp is the story and the least certain number, so the model treats it as the primary stress variable rather than an assumption to defend. Gross margin decides whether growth pays for itself or deepens the burn. CAC against lifetime value shows whether acquisition scales or just spends. And burn against runway is survival: the best plan in the world fails if the cash runs out before the milestone. Get honest ranges on these four and the model does the rest.
Worked example: a seed-stage SaaS startup, in numbers
| Input | Value |
|---|---|
| Starting revenue | $40,000 ARR |
| Year-1 growth | 200%, tapering |
| Gross margin | 78% |
| Monthly gross burn | $120,000 |
| Seed raised | $2.0M |
| Runway at start | ~17 months |
| CAC payback | target under 18 months |
| NOL | losses carried forward |
From ramp to runway and valuation
A startup at $40,000 ARR growing 200% reaches roughly $120,000 by year-end, tiny against a $120,000 monthly burn, which is the whole point of the early stage: the model is spending to build, not to profit. The $2.0M seed gives about 17 months of runway, and the question the model answers is whether that is enough to hit the metric, often a revenue or retention threshold, that unlocks a Series A at a higher valuation. Push growth faster and the burn to support it rises, shortening runway; grow more efficiently and the same cash lasts longer. Because a seed startup has no meaningful near-term cash flow, the DCF is dominated by the out-years the ramp and retention have to deliver, which is exactly why investors stress those assumptions and why the sensitivity tables carry the argument. The losses along the way are carried forward as an NOL, sheltering the first profitable years.
Unit economics: the test that outlives the story
A ramp can be argued; unit economics cannot. The value a customer produces over time against the cost to acquire them is the number that tells an investor whether growth is a business or a subsidy. Early customers often lose money, and that is fine if repeat revenue or retention recovers the acquisition cost within a fundable window, and fatal if it does not. The model builds acquisition cost against a lifetime-value stream that improves with retention, so the free cash flow line can stay negative during the ramp while the underlying economics quietly turn positive. That crossover, from buying growth to owning it, is what separates a startup that raises its next round easily from one that cannot, and it is the number the model is built to surface long before the pitch deck claims it. Investors will forgive early losses if the trend is unmistakable; what they will not forgive is a model that hides deteriorating economics behind a rising top line, which is precisely why the unit-economics view sits beside the ramp rather than beneath it.
Startup model vs a generic financial model
| What differs | Generic model | Startup financial model |
|---|---|---|
| Revenue | Steady growth | Ramp from a tiny base, tapering |
| Profit | Assumed positive | Pre-profit; losses carried forward |
| Key risk | Margin | Runway and the next raise |
| Capital | Passive | Funding rounds and dilution |
| Where value sits | Near-term | Out-years the ramp must deliver |
For grounding survival and growth assumptions in reality, the US Bureau of Labor Statistics tracks business survival rates through its Business Employment Dynamics series, a sobering and useful reference for how many startups reach each year.
Reference: US BLS — Business Employment Dynamics, the benchmark series for business survival rates by age.
How to download your startup model (3 steps)
- Choose the Early-Stage Startup template. The ramp, burn and funding defaults load as editable inputs.
- Set your own revenue ramp, gross margin, burn, funding rounds and CAC. Pick annual or quarterly periods and a 3 to 25-year horizon.
- Preview the linked statements, runway, IRR and DCF, then download the Excel workbook. Up to 3 years is free with just your email; longer horizons are a one-time purchase.
Three focused variants build on the same startup engine: the startup cash flow forecasting model for burn and runway, the startup DCF valuation model for enterprise value and IRR, and the startup free cash flow model for the cash bridge.
Frequently asked questions
What do investors want in startup projections?
A credible revenue ramp, transparent assumptions, burn and runway, and a balance sheet that balances — all produced automatically here in 16 linked sheets.
How many years should startup projections cover?
3–5 years is standard for seed to Series A — fully covered by the free tier.
Can it model pre-revenue losses?
Yes — early losses, NOL carryforward and equity injections are handled so pre-profit startups model correctly.
What do investors look for in a startup financial model?
A credible ramp, honest assumptions, and a clear line to profitability or the next raise. Investors do not believe the year-five number; they test whether the drivers behind it are defensible, whether burn and runway are survivable, and whether the unit economics improve with scale. A model that shows the path and the risks earns more trust than one that only shows a hockey stick.
What is burn rate and runway, and how do you model them?
Burn rate is the net cash a startup consumes each month; runway is the cash balance divided by burn, the months before the money runs out. They are the two numbers that decide whether a startup survives to its next milestone. The model tracks closing cash every period so runway is explicit, and shows how a hire, a price change or a slower ramp moves the date the cash hits zero.
How do you model funding rounds and dilution?
Each round raises cash at a pre-money valuation, which sets the price per share and the equity the new investors take. The model layers rounds onto the cash flow so the capital arrives when runway demands it, and tracks the ownership given up so founders can see dilution across the journey. Raising more than needed wastes equity; raising too little risks a down round, and the model makes that trade visible.
Early-Stage Startup across our four models
Early-Stage Startup Cashflow Forecasting Model · Early-Stage Startup DCF Valuation Model · Early-Stage Startup Free Cashflow Model
More industry financial models
SaaS / Subscription financial model · Data Center financial model · Real Estate financial model · Manufacturing financial model · Hotel / Hospitality financial model · E-commerce / Retail financial model · Healthcare / Clinic financial model · Fintech / Lending financial model · Energy / Solar financial model · Restaurant / F&B financial model · Professional Services financial model · Logistics / Transport financial model · Education / Training financial model · Construction financial model · Media / Content financial model · Telecom / ISP financial model · Agriculture financial model · Pharma / Distribution financial model · Fitness / Wellness financial model · Nonprofit / NGO financial model · Pricing
Free tools
WACC calculator · CAPM calculator · DCF calculator · IRR calculator · Inside the 16-sheet model · Glossary