Nonprofit Financial Model in Excel (Free NGO & Budget Download)
A nonprofit financial model projects donations, grants and program fees against program delivery and administrative costs, producing multi-year budget projections, cash-flow forecasts and a balance sheet — the format grant-makers and boards expect. Generate the full 16-sheet Excel model free for up to 3 years.
⚡ Generate my Nonprofit / NGO model — free (requires JavaScript)
The fastest way to an investor-ready nonprofit / ngo financial model is a template pre-loaded with the industry's real revenue drivers and cost structure. This generator builds a 16-sheet, fully formula-linked Excel workbook — three statements, DCF & IRR — around nonprofit / ngo-specific assumptions in about five minutes. Free up to 3 years, just your email.
Key drivers pre-loaded in this template
| Donations & grants | Primary funding stream, 12% growth default |
| Program fees | Earned-income stream |
| Program costs ~15% COGS | Direct delivery spend, editable |
| No dividends, low WACC | Surplus retained for mission |
What you get
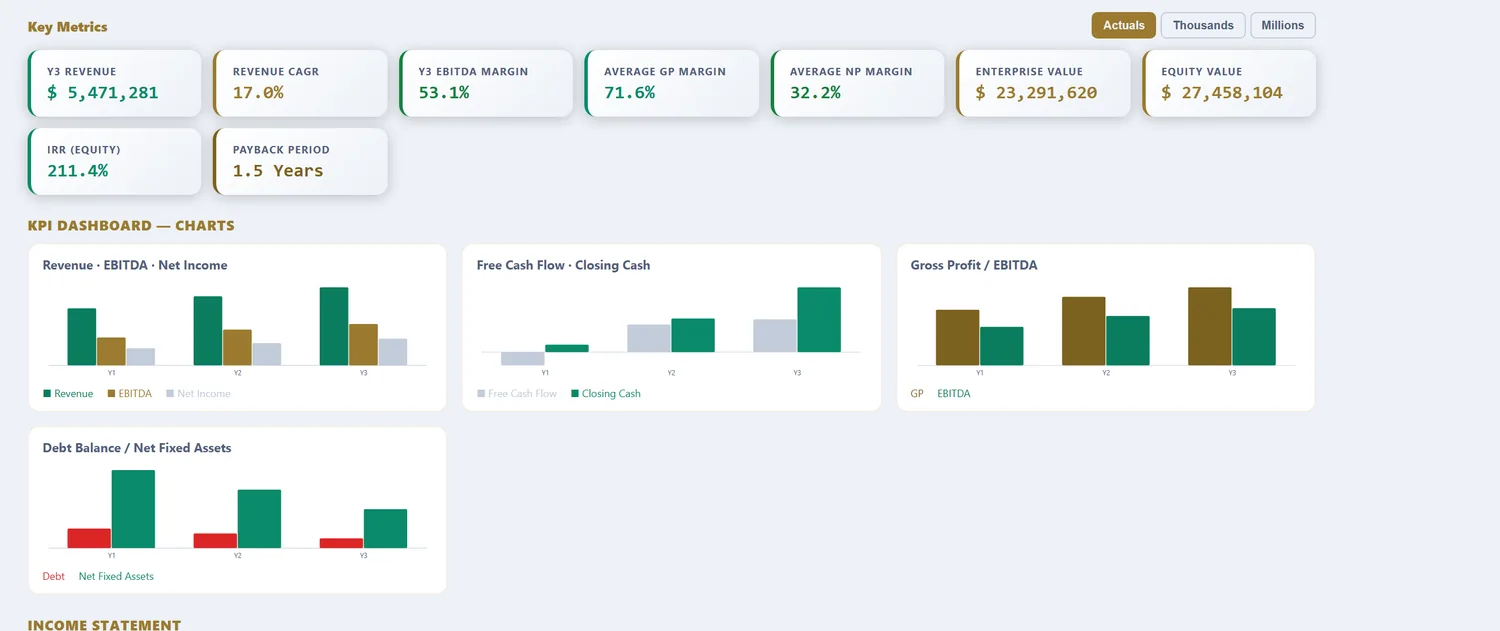
A 16-sheet, fully formula-linked Excel workbook: Assumptions, Revenue, OPEX, CAPEX & Depreciation, Debt, Tax (with loss carryforward), Income Statement, Cash Flow, Balance Sheet, DCF Valuation, Sensitivity tables, a charted KPI Dashboard, a Scenarios sheet (Base, Best & Worst), and an Integrity Check. Free 16-sheet linked Excel download for models up to 3 years (annual or quarterly, just your email). Models from 5 to 25 years are $29.98 per model download.
What a nonprofit financial model computes
A nonprofit or NGO is a mission funded by others, and the model exists to show whether that funding is stable enough to sustain the work. Revenue is donations, grants and program fees, each with its own timing and its own strings attached. Spending splits into program delivery, the mission itself, and the administration and fundraising that enable it. There is no profit motive, so the questions the model answers are different: how much of every dollar reaches the program, how long the reserves would last if funding paused, and whether restricted grants leave enough unrestricted cash to pay core costs. A generic for-profit template, built around margin and valuation, answers none of these.
The template loads nonprofit-scale defaults: revenue from donations, grants and program fees, spending split into program and support, and the restricted-versus-unrestricted distinction that governs what can actually be spent. What follows is what each part does with real nonprofit numbers in it.
Funding sources change the model
Before any numbers, the funding mix sets the stability and the constraints.
| Source | Nature | Constraint | Modelling focus |
|---|---|---|---|
| Individual donations | Recurring + one-off | Mostly unrestricted | Donor retention, campaigns |
| Grants (foundation / govt) | Tranche-based | Often restricted | Timing, reporting, restrictions |
| Program / service fees | Earned income | Unrestricted | Volume, cost recovery |
| Endowment / investment | Income on capital | Spend policy | Draw rate, capital preservation |
Individual donations are often unrestricted and flexible but can be volatile, so donor retention matters like any recurring revenue. Grants bring larger sums but arrive in tranches, come with restrictions and demand reporting, so their timing and conditions shape the cash forecast. Earned program fees are unrestricted and stabilising, moving a nonprofit toward self-reliance. Endowment income depends on a spending policy that balances today's mission against tomorrow's capital. The model keeps the sources separate because their stability and their strings differ sharply, and blending them hides the real funding risk.
Program, admin and the expense ratio
How a nonprofit spends is scrutinised as closely as how it raises, and the split is the story.
| Category | What it covers | Note |
|---|---|---|
| Program services | Direct mission delivery | The ratio funders watch |
| Administration | Governance, finance, ops | Enables the mission |
| Fundraising | Winning the next donation | Costs money to raise money |
| = Program-expense ratio | Program ÷ total spend | Often majority expected |
The program-expense ratio, the share of spending that reaches the mission, is the headline number for funders and watchdogs, and most expect a clear majority on programs. But the pursuit of an ever-higher ratio can starve the administration and fundraising capacity that keep an organisation effective and growing, the so-called overhead trap. The model separates the three categories so the ratio is explicit and can be defended, and so an organisation can show it is investing enough in capacity to remain effective, not just optically lean.
The four drivers that decide nonprofit sustainability
| Driver | Typical focus | Why it dominates |
|---|---|---|
| Funding stability / diversity | Mix across sources | Concentration is the core risk |
| Program-expense ratio | Majority on program | Funder and public trust |
| Restricted vs unrestricted | Core-cost coverage | What can actually be spent |
| Operating reserve | Months of cost held | Survival through a funding gap |
Funding diversity is the central resilience question, because a nonprofit dependent on one grant or one major donor is one decision away from crisis. The program ratio governs trust. The restricted-unrestricted split decides whether the cash on hand can actually pay the core costs. And the operating reserve, months of spending held in unrestricted funds, is the buffer that carries the organisation through a delayed grant or a bad campaign. The model runs all four so sustainability is judged on resilience, not just on this year's balanced budget.
Worked example: a mid-size nonprofit, in numbers
| Input | Value |
|---|---|
| Annual income | $3.0M |
| Donations (unrestricted) | 45% |
| Grants (restricted) | 40% |
| Program fees | 15% |
| Program spending | 78% of total |
| Admin | 13% |
| Fundraising | 9% |
| Operating reserve target | 6 months |
From funding to reserves and resilience
A nonprofit with $3.0M of annual income spends about 78% on programs, a defensible ratio, with 13% on administration and 9% on fundraising. On the surface the budget balances, but the model's job is to test resilience beneath that. Of the income, 40% is restricted grants that can only fund specific projects, so the unrestricted donations and fees have to cover all the core costs, and if they fall short the organisation is squeezed despite looking well-funded in total. The operating reserve, ideally around six months of spending held in unrestricted funds, is the number that says whether the nonprofit could survive a delayed grant or a weak appeal. Over a 3 to 25-year horizon the model runs the funding mix, tracks the reserve, and stress-tests the loss of a major funder, which is the scenario that most often threatens a nonprofit and the one a board most needs to see. It is a sustainability and budgeting tool, so the emphasis is resilience and stewardship rather than valuation.
Grant timing and the cash the calendar creates
A nonprofit can have a balanced annual budget and still run out of cash in a particular month, because grants and campaigns arrive on their own calendar, not the organisation's. A foundation grant might pay in tranches tied to milestones and reporting, a government contract might reimburse in arrears after the money has already been spent, and an annual appeal might land most of its income in a single quarter. Meanwhile salaries and program costs run every month. That mismatch is a genuine liquidity risk that an annual view hides entirely, which is why a monthly cash forecast matters as much for a nonprofit as for any business. The model maps each funding source to when it actually arrives and each cost to when it is paid, so the low points in the year, the moments when reserves are drawn down hardest, are visible and can be planned for, whether through a bridging facility, a reserve draw or the timing of a campaign. For an organisation delivering on restricted grants that reimburse in arrears, this timing view is often the difference between delivering the program and stalling it for want of working capital.
Nonprofit model vs a generic financial model
| What differs | For-profit model | Nonprofit financial model |
|---|---|---|
| Revenue | Sales | Donations, grants and program fees |
| Surplus | Distributed as profit | Retained for the mission |
| Funds | Fungible | Restricted vs unrestricted |
| Key metric | Margin and valuation | Program ratio and reserve months |
| Purpose | Return | Sustainability and stewardship |
Reporting standards and sector benchmarks for grounding a nonprofit budget are set by the IRS Form 990 framework and charity watchdogs; the IRS is the reference for US nonprofit financial reporting and the expense categories funders read.
Reference: IRS — Charities & Nonprofits, the reference for US nonprofit financial reporting and the Form 990 expense framework.
How to download your nonprofit model (3 steps)
- Choose the Nonprofit / NGO template. The donations, grants, program and admin defaults load as editable inputs.
- Set your own funding mix, program ratio, restricted share and reserve target. Pick annual or quarterly periods and a 3 to 25-year horizon.
- Preview the linked statements, reserve and program ratio, then download the Excel workbook. Up to 3 years is free with just your email; longer horizons are a one-time purchase.
Two focused variants build on the same nonprofit engine: the nonprofit cash flow forecasting model for grant-tranche timing and the nonprofit free cash flow model for the surplus retained for the mission.
Frequently asked questions
Do nonprofits need financial models?
Yes — grant applications and board budgets require multi-year income, expenditure and cash projections, which this generates in linked Excel automatically.
How do I show program-spend ratio?
Direct program costs flow through COGS; the income statement then shows program spend versus admin overhead clearly.
Is it really free for NGOs?
Yes — models up to 3 years download free with just your email; 5–25 year models are $29.98 per model download.
How is a nonprofit financial model different from a for-profit one?
The goal is sustainability, not profit. Revenue is donations, grants and program fees rather than sales, any surplus is retained for the mission rather than distributed, and the key ratios are about how much reaches the program and how long the reserves last. The three-statement structure still applies, but the model is read as a multi-year budget and a resilience test, not a route to a valuation or an equity return.
What is the program-expense ratio and why does it matter?
It is the share of total spending that goes to program delivery rather than administration and fundraising, and it is the number funders and watchdogs scrutinise most. Many donors expect a majority of spending on programs, though an unrealistically high ratio can signal underinvestment in the capacity that keeps an organisation effective. The model tracks program, admin and fundraising separately so the ratio is explicit and defensible.
Why do restricted funds complicate a nonprofit model?
Because restricted grants can only be spent on what the donor specified, so an organisation can hold cash it is not free to use for its most pressing need. A nonprofit can look well-funded in total while being short of the unrestricted money that pays core costs. The model separates restricted from unrestricted funds so the truly available cash, and any funding gap on core operations, is visible.
Nonprofit across our four models
Nonprofit / NGO Cashflow Forecasting Model · Nonprofit / NGO DCF Valuation Model · Nonprofit / NGO Free Cashflow Model
More industry financial models
SaaS / Subscription financial model · Data Center financial model · Real Estate financial model · Manufacturing financial model · Hotel / Hospitality financial model · E-commerce / Retail financial model · Healthcare / Clinic financial model · Fintech / Lending financial model · Energy / Solar financial model · Early-Stage Startup financial model · Restaurant / F&B financial model · Professional Services financial model · Logistics / Transport financial model · Education / Training financial model · Construction financial model · Media / Content financial model · Telecom / ISP financial model · Agriculture financial model · Pharma / Distribution financial model · Fitness / Wellness financial model · Pricing
Free tools
WACC calculator · CAPM calculator · DCF calculator · IRR calculator · Inside the 16-sheet model · Glossary