E-commerce Financial Model in Excel (Free AOV, CAC & LTV Download)
An e-commerce financial model projects orders × average order value across direct and marketplace channels, against ~50% COGS and marketing spend near 18% of revenue, producing linked three-statement forecasts with DCF valuation. Generate the full 16-sheet Excel model free for up to 3 years.
⚡ Generate my E-commerce / Retail model — free (requires JavaScript)
The fastest way to an investor-ready e-commerce / retail financial model is a template pre-loaded with the industry's real revenue drivers and cost structure. This generator builds a 16-sheet, fully formula-linked Excel workbook — three statements, DCF & IRR — around e-commerce / retail-specific assumptions in about five minutes. Free up to 3 years, just your email.
Key drivers pre-loaded in this template
| Orders × AOV | Volume-and-basket revenue build |
| COGS ~50% | Product and fulfilment cost base |
| Marketing ~18% of revenue | Paid-acquisition-heavy cost structure |
| WACC ~14% | Higher-risk consumer discount rate |
What you get
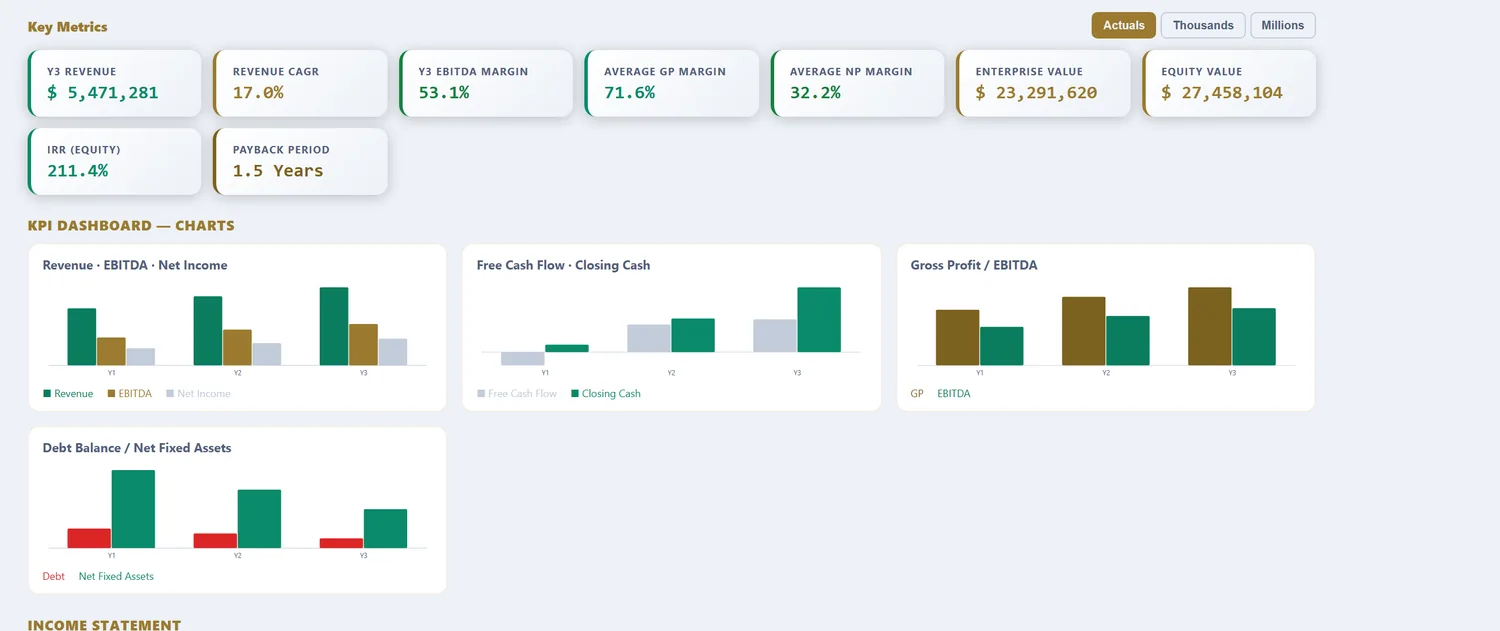
A 16-sheet, fully formula-linked Excel workbook: Assumptions, Revenue, OPEX, CAPEX & Depreciation, Debt, Tax (with loss carryforward), Income Statement, Cash Flow, Balance Sheet, DCF Valuation, Sensitivity tables, a charted KPI Dashboard, a Scenarios sheet (Base, Best & Worst), and an Integrity Check. Free 16-sheet linked Excel download for models up to 3 years (annual or quarterly, just your email). Models from 5 to 25 years are $29.98 per model download.
What an e-commerce financial model computes
Online retail is a unit-economics business dressed up as a revenue business. The headline is orders multiplied by average order value, but the number that decides whether the company survives is what is left after the cost of the goods, the cost of acquiring the customer, fulfilment and returns. That residue is contribution margin, and the model is built to protect it. Around it sit two forces that a generic template gets wrong: customer acquisition cost, which is paid up front for revenue that arrives over many orders, and inventory, which ties up cash long before it turns into a sale.
The template loads retailer-scale defaults: revenue built from orders and average order value across direct and marketplace channels, marketing as the acquisition engine, and inventory driving the working-capital cycle. What follows is what each part does with real retail numbers in it.
Channels change the entire economics
The same product sold through different channels produces very different margins, so the model keeps them separate rather than blending them into one average.
| Channel | Who owns the customer | Margin effect | Modelling focus |
|---|---|---|---|
| Direct-to-consumer (DTC) | You do | Full margin, but you pay CAC | AOV, CAC, repeat rate, fulfilment |
| Marketplace (Amazon, etc.) | The marketplace | Margin net of a 8-20% take rate | Take rate, fees, limited customer data |
| Wholesale / retail partners | The retailer | Lower margin, higher volume | Wholesale price, order size, terms |
Direct-to-consumer keeps the full margin and the customer relationship, but you pay to acquire every buyer, so it lives or dies on CAC and repeat purchase. A marketplace hands you demand and fulfilment reach in exchange for a take rate that can reach a fifth of the sale, and it keeps the customer data, which caps your ability to build lifetime value. Wholesale trades margin for volume and someone else's shelf. Most real retailers run a mix, and the model lets each channel carry its own price, margin and cost so the blend is an output, not a guess.
The contribution-margin waterfall
Gross revenue is a vanity number in retail. The line that matters is what survives to contribution, and the waterfall below is where an online store is won or lost.
| Line | % of gross | Note |
|---|---|---|
| Gross order value | 100% | Orders × AOV |
| Less: returns | -10 to -30% | Contra-revenue; category-dependent |
| Less: cost of goods | -35 to -55% | Product + inbound freight |
| Less: fulfilment & shipping | -10 to -15% | Pick, pack, last-mile, often subsidised |
| Less: payment & platform fees | -2 to -4% | Processor + platform |
| = Contribution before CAC | 20-35% | What is left to fund acquisition and overhead |
Everything above CAC is the unit economics of the product itself, and if contribution before acquisition is thin, no amount of marketing efficiency saves it. Only once that line is healthy does spending to acquire customers make sense, because CAC is funded out of contribution, not revenue.
CAC, LTV and the payback that decides growth
The central tension in e-commerce finance is timing. Customer acquisition cost is spent now; the revenue it buys arrives across future orders. A brand can be deeply unprofitable on the first order and still be an excellent business if customers come back, which is why lifetime value and payback period matter more than first-order margin. The model front-loads marketing against a contribution stream that builds with repeat purchase, so the free cash flow line can stay negative during a growth push while the underlying economics are sound. The test is payback: if it takes eight months of contribution to recover CAC and customers keep buying for years, the losses are an investment; if payback runs past a year and a half with weak repeat rates, they are just losses.
The four assumptions that decide e-commerce returns
| Assumption | Typical range | Why it dominates |
|---|---|---|
| Contribution margin % | 20-35% after returns & fulfilment | The cash each order actually generates |
| Customer acquisition cost | Varies; judged against payback | The largest discretionary cost, funds growth |
| Repeat purchase / retention | Category-dependent | Turns a one-order loss into lifetime value |
| Inventory days | 30-90+ days | Sets the working-capital call on cash |
Contribution margin sets how much each order gives back to fund everything else. CAC is the biggest lever you actually control, and it only makes sense in the context of repeat purchase, because retention is what converts an expensive first order into a profitable customer. Inventory days set the cash trap: a fast-growing store holding 90 days of stock funds a large and rising inventory position out of its own cash, which is the single most common reason a profitable retailer runs short.
Worked example: a DTC brand at scale, in numbers
| Input | Value |
|---|---|
| Orders (year 1) | 120,000 |
| Average order value | $65 |
| Gross revenue | $7.8M |
| Return rate | 15% |
| Cost of goods | 45% of net sales |
| Fulfilment | 12% of net sales |
| Contribution before CAC | ~28% |
| CAC | $22 per customer |
| Repeat rate | 40% within 12 months |
From orders to contribution and IRR
120,000 orders at a $65 average is $7.8M gross, but a 15% return rate trims that to roughly $6.6M of net sales. After cost of goods, fulfilment and fees, contribution before acquisition is about 28%, or near $1.85M. Marketing then funds growth: at a $22 acquisition cost the first order barely breaks even, but a 40% repeat rate means the average customer places well over one order, so the lifetime contribution comfortably clears CAC. Whether the business is investable comes down to how fast that repeat behaviour builds and how much inventory the growth ties up along the way, both of which the model runs explicitly over a 3 to 25-year horizon. Hold repeat rate flat and the DCF looks thin; let it compound and the same brand looks very different, which is why the sensitivity tables earn their place.
Inventory and the cash conversion cycle
The quiet reason online retailers fail is not margin, it is cash timing, and it lives in the cash conversion cycle: the days between paying for stock and collecting from the customer. In e-commerce the customer usually pays instantly, so receivable days are near zero, which is a gift. The trap is inventory. Stock is bought, shipped, warehoused and often held for one to three months before it sells, and every day of that is cash sitting on a shelf. Supplier payment terms offset some of it: thirty or sixty days of payables fund part of the inventory, and the model nets the two into the working-capital movement. The result is blunt. A store growing 60% a year while holding 75 days of inventory has to fund a 60%-larger stock position every year out of its own cash, which is why the fastest-growing brands are so often the ones scrambling for a credit line despite healthy margins. The model shows that call on cash period by period, so the inventory a growth plan requires is visible before it becomes a crisis.
E-commerce model vs a generic financial model
| What differs | Generic model | E-commerce financial model |
|---|---|---|
| Revenue driver | Price × volume | Orders × AOV, net of returns, by channel |
| Margin logic | Single gross margin | Contribution waterfall after CAC and fulfilment |
| Growth cost | Generic marketing % | CAC funded from contribution, judged on payback |
| Working capital | Minor | Inventory-led, often the largest cash call |
| Value driver | Current profit | Repeat purchase and lifetime value |
For grounding long-run channel-share and growth assumptions, the US Census Bureau publishes quarterly e-commerce retail sales as a share of total retail, the standard series for how fast online is taking share.
Reference: US Census Bureau — Quarterly E-Commerce Retail Sales, the benchmark series for online retail penetration.
How to download your e-commerce model (3 steps)
- Choose the E-commerce / Retail template. The orders, AOV, channel and cost defaults load as editable inputs.
- Set your own AOV, return rate, contribution margin, CAC, repeat rate and inventory days. Pick annual or quarterly periods and a 3 to 25-year horizon.
- Preview the linked statements, contribution, IRR and DCF, then download the Excel workbook. Up to 3 years is free with just your email; longer horizons are a one-time purchase.
Three focused variants build on the same e-commerce engine: the e-commerce cash flow forecasting model for the inventory cash cycle, the e-commerce DCF valuation model for enterprise value and IRR, and the e-commerce free cash flow model for the CAPEX-to-FCF bridge and peak funding need.
Frequently asked questions
What growth rate should I assume?
The template defaults to 40% early growth tapering over time; replace it with your own cohort or traffic-based estimate.
Can I separate D2C and marketplace revenue?
Yes — model them as independent streams with their own growth and inflation assumptions.
Is 5 years enough for an e-commerce plan?
Usually yes — most e-commerce plans and fundraises use 3–5 year horizons, fully covered by the free tier.
What is a good CAC payback period for e-commerce?
Customer acquisition cost payback is how many months of contribution margin it takes to recover the cost of winning a customer. Efficient direct-to-consumer brands target 6-12 months; beyond about 18 months, growth spend is usually outrunning the unit economics. The model tracks payback against repeat-purchase behaviour so first-order losses can be justified by lifetime value, or not.
How do I model returns in an e-commerce forecast?
Returns are a contra-revenue line, not an afterthought. Apparel can see 20-40% returns while consumables sit in low single digits, and each return costs the reverse shipping and often the margin on the item. The model applies a return rate to gross sales and carries the cost so contribution margin reflects what the business actually keeps.
Why does a profitable online store still run out of cash?
Inventory. Stock is bought and paid for before it sells, so a growing store funds an ever-larger inventory position out of cash even while every order is profitable. The model turns inventory days and payable days into the working-capital movement, which is usually the largest single call on cash in a scaling retailer.
E-commerce across our four models
E-commerce / Retail Cashflow Forecasting Model · E-commerce / Retail DCF Valuation Model · E-commerce / Retail Free Cashflow Model
More industry financial models
SaaS / Subscription financial model · Data Center financial model · Real Estate financial model · Manufacturing financial model · Hotel / Hospitality financial model · Healthcare / Clinic financial model · Fintech / Lending financial model · Energy / Solar financial model · Early-Stage Startup financial model · Restaurant / F&B financial model · Professional Services financial model · Logistics / Transport financial model · Education / Training financial model · Construction financial model · Media / Content financial model · Telecom / ISP financial model · Agriculture financial model · Pharma / Distribution financial model · Fitness / Wellness financial model · Nonprofit / NGO financial model · Pricing
Free tools
WACC calculator · CAPM calculator · DCF calculator · IRR calculator · Inside the 16-sheet model · Glossary