Restaurant Financial Model in Excel (Free F&B & Covers Download)
A restaurant financial model projects dine-in revenue (covers × average spend) plus delivery income against ~35% food cost, rent, staffing and fit-out CAPEX, producing linked statements with payback and IRR. Generate the full 16-sheet Excel model free for up to 3 years.
⚡ Generate my Restaurant / F&B model — free (requires JavaScript)
The fastest way to an investor-ready restaurant / f&b financial model is a template pre-loaded with the industry's real revenue drivers and cost structure. This generator builds a 16-sheet, fully formula-linked Excel workbook — three statements, DCF & IRR — around restaurant / f&b-specific assumptions in about five minutes. Free up to 3 years, just your email.
Key drivers pre-loaded in this template
| Covers × average spend | Dine-in revenue build |
| Delivery stream | Aggregator and takeaway income |
| Food cost ~35% | Industry-standard COGS default |
| Rent $8k/month default | Location-driven fixed cost |
What you get
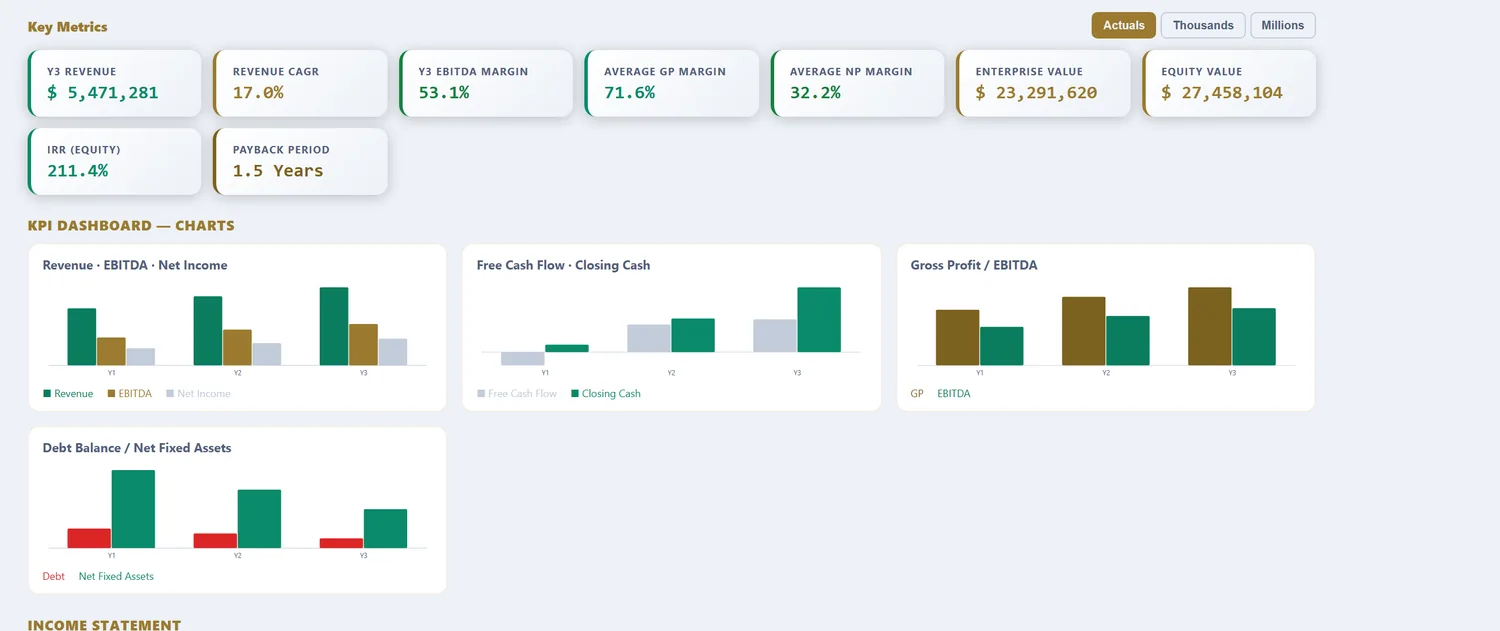
A 16-sheet, fully formula-linked Excel workbook: Assumptions, Revenue, OPEX, CAPEX & Depreciation, Debt, Tax (with loss carryforward), Income Statement, Cash Flow, Balance Sheet, DCF Valuation, Sensitivity tables, a charted KPI Dashboard, a Scenarios sheet (Base, Best & Worst), and an Integrity Check. Free 16-sheet linked Excel download for models up to 3 years (annual or quarterly, just your email). Models from 5 to 25 years are $29.98 per model download.
What a restaurant financial model computes
A restaurant is a thin-margin volume business where a few controllable costs decide everything. Revenue is covers multiplied by average check, plus a growing delivery stream, and against it sit the two costs an operator actually controls day to day: food and labour, together the prime cost. Rent, utilities and overhead are largely fixed. The whole discipline of restaurant finance is keeping prime cost in a band that leaves room for the fixed costs and a margin, because the net line is thin enough that a few points of food cost or an over-staffed shift erases it. A generic template blends all this into one margin and misses the prime-cost mechanics that operators live by.
The template loads restaurant-scale defaults: revenue from covers and average check plus delivery, food cost near 30%, labour alongside it, and fit-out CAPEX on the schedule. What follows is what each part does with real F&B numbers in it.
Format changes the model
Before any numbers, the restaurant format sets the cost structure and the volume rhythm.
| Format | Revenue basis | Cost profile | Modelling focus |
|---|---|---|---|
| Quick-service (QSR) | High covers, low check | Lower labour, fast turns | Volume, speed, delivery share |
| Casual dining | Moderate covers and check | Balanced prime cost | Table turns, average check |
| Fine dining | Low covers, high check | High labour and food cost | Check, experience, low turns |
| Delivery / ghost kitchen | Orders, no dine-in | No front-of-house | Commission, packaging, throughput |
Quick-service lives on volume and speed, with lower labour and a rising delivery share. Casual dining balances covers and check and turns on table utilization. Fine dining inverts it, few covers at a high check with high labour and food cost, so the experience justifies the price. A ghost kitchen strips out the dining room entirely and lives or dies on delivery commission and throughput. The model keeps the format explicit because the same food can be a very different business depending on how it is sold.
Prime cost: the number operators live by
Everything in a restaurant P&L orbits prime cost.
| Cost | Share | Note |
|---|---|---|
| Food & beverage cost | 28-35% | Controllable; menu and waste |
| Labour (all-in) | 28-35% | Controllable; scheduling to demand |
| = Prime cost | Under 60-65% target | The make-or-break band |
| Rent & occupancy | 6-10% | Fixed; set at signing |
| Other overhead | 10-15% | Utilities, marketing, admin |
Food cost and labour are the two an operator adjusts every week, through the menu, portioning, waste control and scheduling to demand, which is why they are grouped as prime cost and watched together. Rent is fixed the day the lease is signed and cannot be fixed later, so a bad location choice haunts every month. The model separates the controllable prime cost from the fixed occupancy so an operator can see which lever actually moves the result, and by how much.
The four assumptions that decide restaurant returns
| Assumption | Typical range | Why it dominates |
|---|---|---|
| Covers / table turns | Format-dependent | Volume against a fixed base |
| Average check | Format-dependent | Revenue per cover |
| Prime cost % | Under 60-65% | The controllable margin |
| Delivery share & commission | 15-30% commission | Dilutes blended margin |
Covers fill the fixed base, so getting more turns out of the same seats and kitchen is the cheapest revenue a restaurant has. Average check lifts revenue per cover through menu and upsell. Prime cost is the controllable margin that has to stay in band. And delivery share, at a 15-30% commission, quietly dilutes the blended margin, so a restaurant chasing delivery volume can grow revenue while shrinking profit. The model runs all four so a growth plan is judged on margin, not just on how busy the kitchen looks.
Worked example: a casual-dining restaurant, in numbers
| Input | Value |
|---|---|
| Seats | 80 |
| Covers per day | 220 |
| Average check | $32 |
| Annual revenue | ~$2.57M |
| Food cost | 30% |
| Labour | 30% |
| Prime cost | 60% |
| Rent | 8% |
| Fit-out CAPEX | $600,000 |
From covers to margin and IRR
80 seats turning to 220 covers a day at a $32 average is roughly $2.57M of annual revenue. At a 60% prime cost the controllable costs take about $1.54M, and after 8% rent and the rest of overhead the net margin lands in the high single digits, normal and unforgiving for casual dining. The sensitivity is stark: let prime cost drift to 65% and the net margin can halve, while adding two covers per table per day lifts revenue against a fixed cost base and flows heavily to profit. Delivery cuts the other way, because a 25% commission on a growing delivery share dilutes the blend. Over a 3 to 25-year horizon the model funds the periodic refresh of the fit-out, carries the thin margin, and produces the DCF and IRR, where cover volume and prime-cost discipline decide whether the restaurant compounds or just survives. A second or third site changes the picture again, adding central overhead and the opening ramp of each new location, which the model stages so a rollout is judged on the same honest economics as the first restaurant rather than an optimistic average.
The opening ramp: why year one burns cash
A new restaurant rarely makes money on day one, and a model that assumes stabilised covers from opening is dangerously optimistic. The fit-out and pre-opening costs go out before a single guest arrives, and then covers build slowly as the location earns its reputation, so the first six to twelve months often run at a loss while fixed rent and a full kitchen brigade are paid against thin early volume. That ramp is the single most under-modelled part of a restaurant plan, and it sets the working capital an operator actually needs to survive to stabilisation. The model stages the cover ramp explicitly rather than switching on full volume at opening, so the cash required to reach a profitable run-rate is visible before the lease is signed. Underestimate the ramp and a restaurant that would have thrived closes in month eight for want of cash it could have planned for. On the worked example, opening at half the stabilised 220 covers and building over nine months can mean a six-figure cash shortfall on top of the fit-out, money the operator needs committed before the doors open, not discovered afterward.
Restaurant model vs a generic financial model
| What differs | Generic model | Restaurant financial model |
|---|---|---|
| Revenue driver | Price × volume | Covers × average check, plus delivery |
| Cost focus | Blended margin | Prime cost: food + labour, separated |
| Delivery | Ignored | Separate stream, commission-adjusted |
| CAPEX | Steady spend | Fit-out plus periodic refresh |
| Margin | Comfortable | Thin, high single digits typical |
Sector cost and sales benchmarks for calibrating prime cost and check assumptions are published by the National Restaurant Association, the standard industry reference for US food-service economics.
Reference: National Restaurant Association — Research, the benchmark source for US food-service cost and sales data.
How to download your restaurant model (3 steps)
- Choose the Restaurant / F&B template. The covers, check, food-cost and labour defaults load as editable inputs.
- Set your own covers, average check, prime cost, delivery share and fit-out CAPEX. Pick annual or quarterly periods and a 3 to 25-year horizon.
- Preview the linked statements, prime cost, margin and IRR, then download the Excel workbook. Up to 3 years is free with just your email; longer horizons are a one-time purchase.
Three focused variants build on the same restaurant engine: the restaurant cash flow forecasting model for the opening cash gap, the restaurant DCF valuation model for enterprise value and IRR, and the restaurant free cash flow model for the fit-out-to-FCF bridge.
Frequently asked questions
What food-cost percentage should I use?
28–35% of revenue is typical; the template defaults to 35% and is fully editable.
Does it show payback on fit-out?
Yes — the KPI dashboard shows the payback period on your initial CAPEX.
Can I model multiple locations?
Model a second site as an additional revenue stream, or generate separate models per location.
What is prime cost and why does it decide a restaurant's survival?
Prime cost is food and beverage cost plus total labour, and it is the number operators watch above all others because together they are controllable and dominate the P&L. A well-run restaurant keeps prime cost below about 60-65% of revenue; above that, rent and overhead leave nothing behind. Because restaurant net margins are thin, a few points of prime cost is the difference between profit and closure.
How does delivery affect restaurant economics?
Delivery adds revenue but at a cost: marketplace platforms typically take 15-30% commission, and packaging and the marginal kitchen load eat further into the margin. A delivery order can carry half the contribution of a dine-in cover at the same check. The model keeps dine-in and delivery as separate streams so the true margin on each is visible, rather than a blended average that flatters delivery.
What net margin should a restaurant expect?
Thinner than most people assume. After food cost near 30%, labour near 30% and rent, utilities and overhead, a healthy independent restaurant nets in the high single digits, and many run lower. That thin margin is why prime-cost control and cover volume matter so much, and why the model separates the controllable costs from the fixed ones so an operator can see exactly which lever moves the result.
Restaurant across our four models
Restaurant / F&B Cashflow Forecasting Model · Restaurant / F&B DCF Valuation Model · Restaurant / F&B Free Cashflow Model
More industry financial models
SaaS / Subscription financial model · Data Center financial model · Real Estate financial model · Manufacturing financial model · Hotel / Hospitality financial model · E-commerce / Retail financial model · Healthcare / Clinic financial model · Fintech / Lending financial model · Energy / Solar financial model · Early-Stage Startup financial model · Professional Services financial model · Logistics / Transport financial model · Education / Training financial model · Construction financial model · Media / Content financial model · Telecom / ISP financial model · Agriculture financial model · Pharma / Distribution financial model · Fitness / Wellness financial model · Nonprofit / NGO financial model · Pricing
Free tools
WACC calculator · CAPM calculator · DCF calculator · IRR calculator · Inside the 16-sheet model · Glossary