Fintech Financial Model in Excel (Free Lending & Payments Download)
A fintech or lending financial model projects interest income from loan book × net interest margin plus fee revenue, against funding costs, technology spend and credit losses, producing linked statements with DCF valuation. Generate a 16-sheet Excel model free for up to 3 years.
⚡ Generate my Fintech / Lending model — free (requires JavaScript)
The fastest way to an investor-ready fintech / lending financial model is a template pre-loaded with the industry's real revenue drivers and cost structure. This generator builds a 16-sheet, fully formula-linked Excel workbook — three statements, DCF & IRR — around fintech / lending-specific assumptions in about five minutes. Free up to 3 years, just your email.
Key drivers pre-loaded in this template
| Loan book × NIM | Interest-income engine |
| Fee income stream | Origination and servicing fees |
| High growth defaults | 45% early book growth, tapering |
| WACC ~14% | Venture-stage fintech discount rate |
What you get
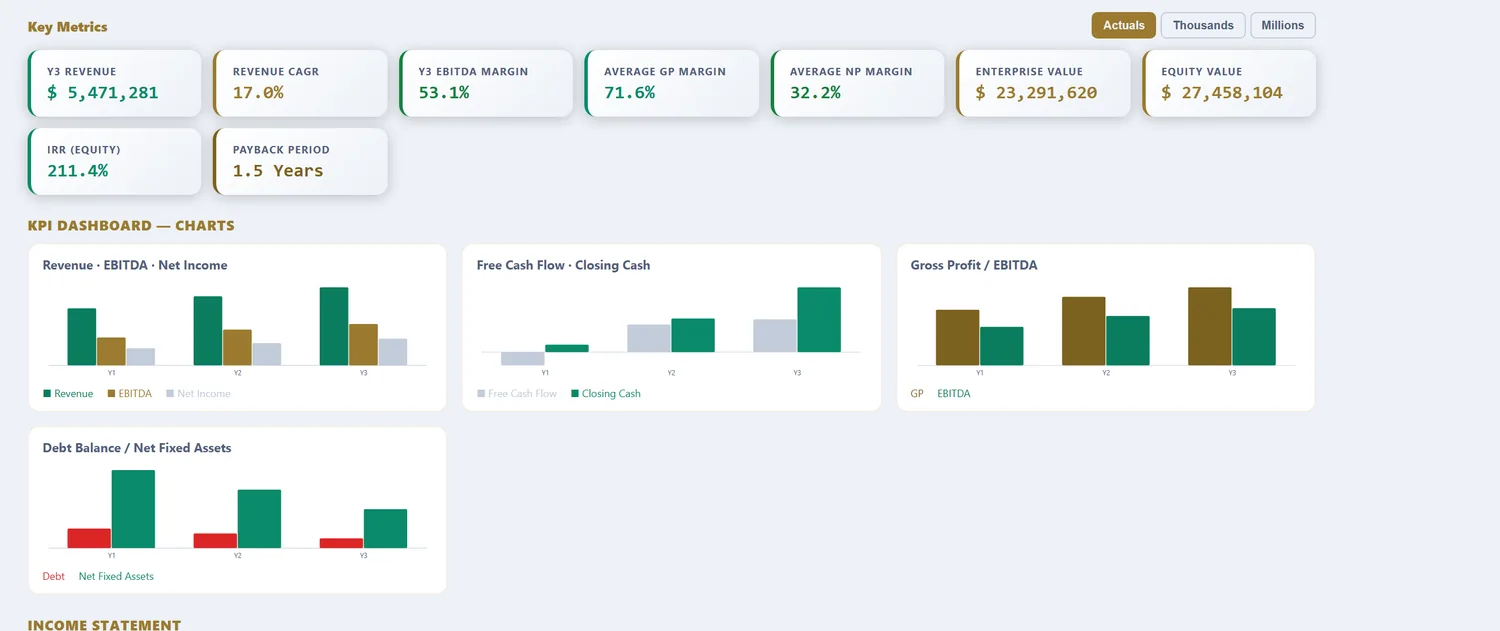
A 16-sheet, fully formula-linked Excel workbook: Assumptions, Revenue, OPEX, CAPEX & Depreciation, Debt, Tax (with loss carryforward), Income Statement, Cash Flow, Balance Sheet, DCF Valuation, Sensitivity tables, a charted KPI Dashboard, a Scenarios sheet (Base, Best & Worst), and an Integrity Check. Free 16-sheet linked Excel download for models up to 3 years (annual or quarterly, just your email). Models from 5 to 25 years are $29.98 per model download.
What a fintech financial model computes
Fintech is not one business, it is at least two, and the model has to know which. A lender earns a spread on money it lends and funds, so its economics live in net interest margin and credit losses. A payments platform earns a fee on money that flows through it, so its economics live in volume and take rate. What they share is a dependence on unit economics: the cost to acquire a customer against the value that customer produces over time, in a market where growth is cheap to buy and expensive to sustain. A generic template treats fintech as a normal revenue business and misses the two things that decide it, the spread or take rate on one side and the cost of risk or processing on the other.
The template loads platform-scale defaults: revenue from a lending book or transaction volume, funding and processing costs, acquisition spend, and a credit-loss provision for lenders. What follows is what each part does with real fintech numbers in it.
Lending or payments: two different machines
Before any numbers, the business model sets the entire structure of the forecast.
| Model | Revenue | Main risk | Modelling focus |
|---|---|---|---|
| Lending / credit | Loan book × NIM | Credit losses | NIM, cost of risk, funding |
| Payments | Volume × take rate | Fraud, processing | Volume, take rate, cost per transaction |
| Wealth / SaaS-fee | Assets or subscription × fee | Churn | Retention, fee compression |
| Neobank (blended) | Interchange + interest + fees | Mixed | Blend of all three, unit economics |
A lender is a balance-sheet business: it needs funding, it takes credit risk, and its profit is the spread net of losses. A payments platform is asset-light: it takes a slice of flow, carries fraud and processing cost rather than credit risk, and scales on volume. Wealth platforms earn a fee on assets or a subscription and live on retention against fee compression. Neobanks blend all three, which is why their models are the hardest to read and where unit economics matter most. The template keeps the revenue engine explicit so the right risks are modelled rather than blurred.
Revenue and the cost of risk
For a lender, the path from gross yield to profit runs through two subtractions that a generic model usually skips.
| Line | Rate on book | Note |
|---|---|---|
| Interest yield | 15-25% | Gross rate charged to borrowers |
| Less: funding cost | -4 to -8% | Cost of the money lent |
| = Net interest margin | 10-17% | The gross spread |
| Less: cost of risk | -2 to -8% | Expected credit losses |
| = Risk-adjusted margin | 4-12% | What is left to cover opex |
The gross yield looks generous, but funding cost and credit losses take large bites, and the survivors of fintech lending are the ones that price risk correctly rather than chase volume. The model provisions for losses as the book grows, so a business booking aggressive interest income against thin provisions shows the flattering picture and the honest one side by side.
The four assumptions that decide fintech returns
| Assumption | Typical range | Why it dominates |
|---|---|---|
| NIM or take rate | 10-17% NIM / 0.5-3% take | The core revenue engine |
| Cost of risk (lenders) | 2-8% of book | Turns spread into profit or loss |
| CAC & payback | Judged on LTV | The largest growth cost |
| Volume / book growth | Varies | Scales fixed platform cost |
For a lender, NIM and cost of risk together decide almost everything, because a wide spread means nothing if losses eat it. For a payments business, the take rate and volume do the same job with processing cost in the risk seat. Across both, acquisition cost judged against lifetime value sets how efficiently growth is bought, and growth itself spreads the fixed cost of the platform and its compliance base. Get these four right and the rest is arithmetic.
Worked example: a lending fintech, in numbers
| Input | Value |
|---|---|
| Loan book (year 1) | $50M |
| Interest yield | 20% |
| Funding cost | 6% |
| Net interest margin | 14% |
| Cost of risk | 5% |
| Risk-adjusted margin | 9% |
| Fee income | +2% of book |
| CAC | judged on payback |
| Book growth | 40% tapering |
From book to risk-adjusted margin and IRR
A $50M book at a 20% yield earns $10M of interest income, and a 6% funding cost takes $3M, leaving a 14% net interest margin, or $7M. Then cost of risk bites: at 5% of the book, provisions take $2.5M, so the risk-adjusted margin is 9%, about $4.5M, before operating cost and acquisition. That is the honest engine of the business, and it is why a lender growing its book 40% a year while under-provisioning can look wildly profitable right up until the losses arrive. Add fee income, subtract opex and CAC, and the free cash flow line stays thin during the growth phase because the book has to be funded before it earns. Over a 3 to 25-year horizon the model compounds the book, provisions honestly, and produces the DCF and IRR, where the discount rate carries real weight because the value sits in future years the credit assumptions have to protect.
Regulatory capital and funding
A lending fintech cannot grow on optimism alone, because a balance-sheet business needs capital and funding to stand behind the book. Equity absorbs losses, debt or deposits fund the loans, and regulators or lenders set how much of each is required as the book scales. That is why a lender's growth is capital-constrained in a way a payments platform's is not: doubling the book means finding the funding and holding the capital to support it. The model keeps funding and equity explicit so the capital a growth plan requires is visible, and so a plan that outruns its funding shows the wall before the business hits it. A lender that raises equity too late, or leans on funding that reprices when rates move, can see its net interest margin squeezed at exactly the moment the book is largest, which is why the funding structure belongs in the model rather than assumed away.
Fintech model vs a generic financial model
| What differs | Generic model | Fintech financial model |
|---|---|---|
| Revenue driver | Price × volume | Book × NIM, or volume × take rate |
| Hidden cost | None | Cost of risk / credit provisioning |
| Balance sheet | Passive | Funding and capital constrain growth |
| Growth cost | Marketing % | CAC judged on LTV and payback |
| Where value sits | Current profit | Future book quality and retention |
For grounding adoption and inclusion assumptions, the World Bank's Global Findex database tracks account ownership and digital-payments use across markets, the standard reference for a fintech's addressable headroom.
Reference: World Bank — Global Findex Database. For a valuation-first view, use the fintech DCF valuation model.
How to download your fintech model (3 steps)
- Choose the Fintech / Lending template. The book, NIM or take-rate, cost-of-risk and CAC defaults load as editable inputs.
- Set your own yield, funding cost, cost of risk or take rate, growth and acquisition spend. Pick annual or quarterly periods and a 3 to 25-year horizon.
- Preview the linked statements, risk-adjusted margin, IRR and DCF, then download the Excel workbook. Up to 3 years is free with just your email; longer horizons are a one-time purchase.
Three focused variants build on the same fintech engine: the fintech cash flow forecasting model for funding and burn, the fintech DCF valuation model for enterprise value and IRR, and the fintech free cash flow model for the FCF bridge.
Frequently asked questions
Can it model a growing loan book?
Yes — model interest income as a revenue stream with growth bands tracking book expansion.
How do I reflect funding costs?
Use the debt module: principal, rate, tenor and grace period generate a full funding schedule.
What horizon do fintech investors want?
Venture rounds use 3–5 years (3-year model free); lending vehicles with long-dated books may extend to 10+ years with premium.
What is net interest margin (NIM) in a lending model?
Net interest margin is the spread a lender earns: interest income on the loan book minus the cost of the funding behind it, expressed against average assets. A book yielding 18% funded at 6% earns a 12% gross margin before losses. NIM is the engine of a lending fintech, and the model builds it explicitly so funding cost and yield can be flexed separately rather than assumed as one net number.
What is cost of risk and why does it decide a lender's fate?
Cost of risk is the credit loss provision expressed as a percentage of the loan book, and it is what separates a good lender from a failed one. A book earning a 12% margin but losing 8% to defaults keeps only 4% before costs; the same book at 3% losses keeps 9%. Because losses arrive after the revenue is booked, the model provisions against expected defaults so profit reflects risk, not just spread.
How do you model a payments fintech versus a lender?
A payments business earns a take rate on transaction volume and carries almost no credit risk, so it turns on volume growth, take rate and processing cost. A lender earns a margin on a balance sheet it funds and provisions for losses, so it turns on NIM and cost of risk. They are different models with different risks, and the template runs either, because a fintech's economics depend entirely on which one it is.
Fintech across our four models
Fintech / Lending Cashflow Forecasting Model · Fintech / Lending DCF Valuation Model · Fintech / Lending Free Cashflow Model
More industry financial models
SaaS / Subscription financial model · Data Center financial model · Real Estate financial model · Manufacturing financial model · Hotel / Hospitality financial model · E-commerce / Retail financial model · Healthcare / Clinic financial model · Energy / Solar financial model · Early-Stage Startup financial model · Restaurant / F&B financial model · Professional Services financial model · Logistics / Transport financial model · Education / Training financial model · Construction financial model · Media / Content financial model · Telecom / ISP financial model · Agriculture financial model · Pharma / Distribution financial model · Fitness / Wellness financial model · Nonprofit / NGO financial model · Pricing
Free tools
WACC calculator · CAPM calculator · DCF calculator · IRR calculator · Inside the 16-sheet model · Glossary