Manufacturing Financial Model in Excel (Free Plant & Margin Download)
A manufacturing financial model projects product and spare-parts revenue against ~60% COGS, plant and machinery CAPEX, depreciation schedules and working-capital needs, producing linked three-statement forecasts with DCF and IRR. Generate the full 16-sheet Excel model free for up to 3 years.
⚡ Generate my Manufacturing model — free (requires JavaScript)
The fastest way to an investor-ready manufacturing financial model is a template pre-loaded with the industry's real revenue drivers and cost structure. This generator builds a 16-sheet, fully formula-linked Excel workbook — three statements, DCF & IRR — around manufacturing-specific assumptions in about five minutes. Free up to 3 years, just your email.
Key drivers pre-loaded in this template
| Units × margin | Volume-and-price revenue build |
| COGS ~60% of revenue | Material and direct-labour heavy cost base |
| $2M plant CAPEX default | Straight-line depreciation over useful life |
| Working capital days | Receivables, inventory and payables cycle |
What you get
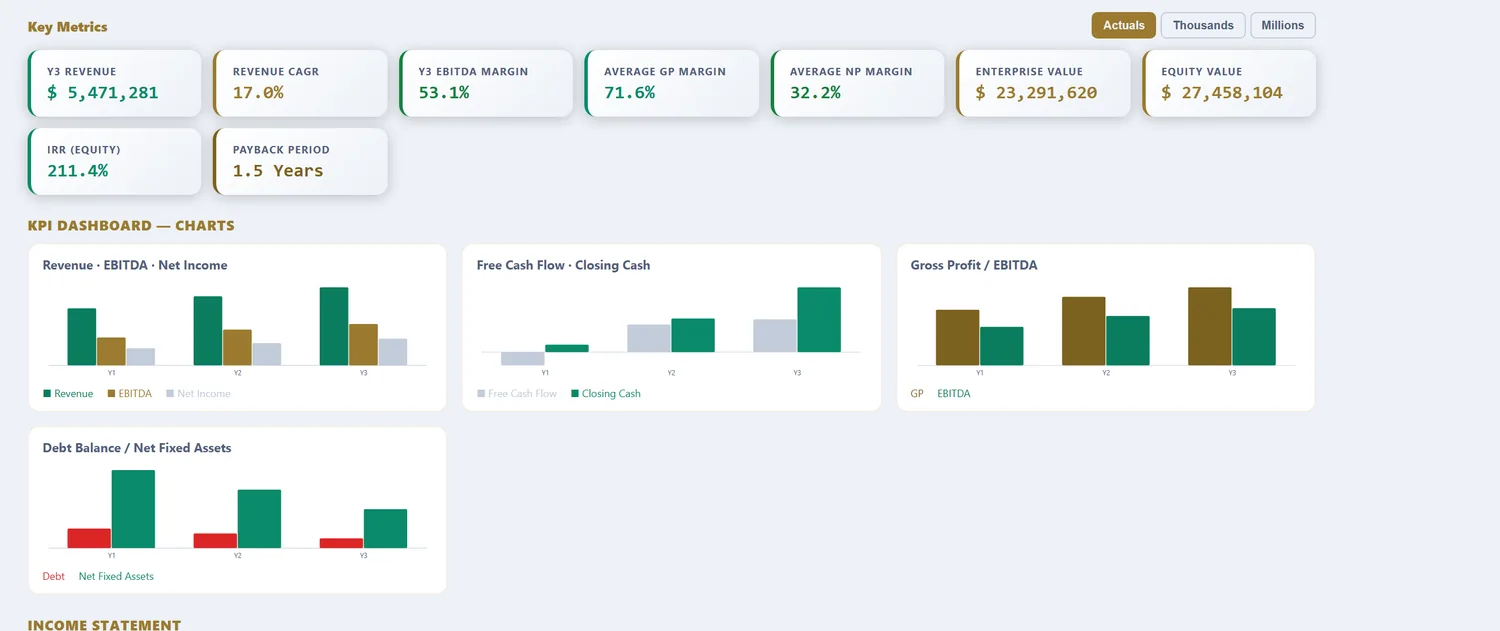
A 16-sheet, fully formula-linked Excel workbook: Assumptions, Revenue, OPEX, CAPEX & Depreciation, Debt, Tax (with loss carryforward), Income Statement, Cash Flow, Balance Sheet, DCF Valuation, Sensitivity tables, a charted KPI Dashboard, a Scenarios sheet (Base, Best & Worst), and an Integrity Check. Free 16-sheet linked Excel download for models up to 3 years (annual or quarterly, just your email). Models from 5 to 25 years are $29.98 per model download.
What a manufacturing financial model computes
A factory is a fixed-cost machine that turns materials into margin, and the whole model is about how well it does that at different volumes. Revenue is units multiplied by price, often across a product mix plus spare parts. Against it sits the cost of goods sold, roughly 55-70% of revenue, split between materials that vary with output and factory overhead that does not. The two forces that decide whether a plant makes money are capacity utilization, how much of the machine you actually use, and operating leverage, how hard profit swings when volume moves. A generic template misses both by treating cost as a single blended margin.
The template loads plant-scale defaults: product and spare-parts revenue, COGS near 60%, machinery on the CAPEX schedule with real depreciation, and an inventory-led working-capital cycle. What follows is what each part does with real manufacturing numbers in it.
Fixed versus variable: where the leverage comes from
The most important split in a manufacturing model is not by department, it is by behaviour. Which costs move with volume, and which do not.
| Cost type | Examples | Behaviour | Effect |
|---|---|---|---|
| Variable | Raw materials, direct labour, energy | Moves with each unit | Sets contribution margin per unit |
| Semi-fixed | Supervision, maintenance, utilities | Steps up in blocks | Adds cost at capacity thresholds |
| Fixed | Depreciation, salaried staff, rent | Flat across volume | Spread thinner as output rises |
Variable cost sets the contribution margin: price minus the cost of making one more unit, which is the cash each sale gives back toward covering fixed cost. Fixed cost is the hurdle. Below the break-even volume the plant loses money because fixed cost is not yet covered; above it, most of each unit's contribution is profit. That asymmetry is operating leverage, and it is why utilization matters so much. The model keeps the split explicit so break-even and the profit swing are readable rather than buried in a single margin.
The cost structure inside COGS
Cost of goods sold is not one number. It has three parts, and each behaves differently through a cycle.
| Component | Share of COGS | Behaviour |
|---|---|---|
| Direct materials | 45-60% | Variable; exposed to commodity prices |
| Direct labour | 15-25% | Variable to semi-fixed by shift |
| Factory overhead | 20-35% | Mostly fixed: depreciation, maintenance, utilities |
Materials are the largest and the most exposed to input prices, so a commodity spike hits gross margin directly unless it can be passed through in price. Direct labour flexes with shifts but not instantly. Factory overhead, dominated by machine depreciation and plant maintenance, is fixed, which is exactly why spreading it over more units through higher utilization is the cheapest margin a manufacturer can find.
The four assumptions that decide manufacturing returns
| Assumption | Typical range | Why it dominates |
|---|---|---|
| Capacity utilization | 65-90% | Spreads fixed cost; the biggest profit lever |
| Gross margin (price − variable) | 30-45% | Contribution per unit against a fixed base |
| Plant CAPEX & useful life | 7-15 yr machinery | Sets depreciation and replacement cash |
| Working-capital days | 60-100 day cycle | The cash a growing plant ties up |
Utilization is the master lever because the plant's fixed cost is already committed. Gross margin sets how much each unit contributes toward that fixed base and beyond. CAPEX and machinery life drive the depreciation that sits in overhead and the replacement cash that a long-horizon model has to fund. And working-capital days set the cash trap: a manufacturer growing fast while holding two to three months of inventory funds an ever-larger stock position out of its own cash, profitable or not.
Worked example: a components plant, in numbers
| Input | Value |
|---|---|
| Units (year 1) | 500,000 |
| Price per unit | $24 |
| Revenue | $12.0M |
| Variable cost per unit | $14 |
| Contribution margin | 42% |
| Fixed cost (overhead + salaried) | $3.6M |
| Plant CAPEX | $5.0M, 10-yr life |
| Capacity utilization | 70% |
| Inventory days | 75 |
From volume to margin and IRR
500,000 units at $24 is $12.0M of revenue, and at a $14 variable cost each unit contributes $10, or 42%. That is $5.0M of total contribution against $3.6M of fixed cost, leaving roughly $1.4M of operating profit at 70% utilization. Now push utilization to 85%: revenue rises about 21% while fixed cost barely moves, and operating profit jumps far more than the volume did, because almost all the extra contribution is profit. That is the leverage that makes manufacturing attractive when demand is strong and painful when it is not. Over a 3 to 25-year horizon the model runs that curve honestly, funds the machinery replacement, and shows the working capital each volume level demands, which is where the DCF and the sensitivity tables earn their place.
Working capital: the cash tied up in the factory
Manufacturing ties up cash at three stages at once. Raw materials are bought and stored, work in progress sits on the floor part-finished, and finished goods wait to ship, all before a B2B customer pays on 45 to 60 day terms. Supplier payables fund part of it, but the net cash conversion cycle still commonly runs 60 to 100 days. The consequence is blunt: growth consumes cash, because a plant making 30% more units next year has to fund 30% more inventory and receivables first. The model nets inventory, receivable and payable days into the working-capital movement so the funding need shows up before it becomes a covenant conversation.
Break-even: the volume that pays for the plant
Every manufacturing model has a hidden line that decides everything above it: the break-even volume, the number of units at which contribution finally covers fixed cost and the plant stops losing money. In the worked example, $3.6M of fixed cost divided by $10 of contribution per unit puts break-even at 360,000 units, so the first 360,000 units of the year fund the factory and only the units beyond that make profit. That single number reframes the whole business. A plant running at 70% of a capacity that sits well above break-even is comfortable; one whose break-even is close to full capacity has no margin for a soft quarter. The model computes break-even against capacity so you can see how much cushion a volume plan actually has, and stress it by moving price or input cost, both of which shift the break-even point directly.
Manufacturing model vs a generic financial model
| What differs | Generic model | Manufacturing financial model |
|---|---|---|
| Revenue driver | Price × volume | Units × price across product mix and spares |
| Cost logic | Single gross margin | Fixed vs variable split, contribution and break-even |
| Volume response | Linear | Operating leverage around break-even |
| CAPEX | Steady spend | Plant and machinery with replacement cycle |
| Working capital | Minor | Inventory-led, 60-100 day cash cycle |
Capacity utilization and its long-run averages are published monthly by the Federal Reserve in the G.17 Industrial Production and Capacity Utilization release, the standard reference for how hard US industry is running.
Reference: Federal Reserve G.17 — Industrial Production and Capacity Utilization, the benchmark series for US manufacturing utilization.
How to download your manufacturing model (3 steps)
- Choose the Manufacturing template. The units, price, COGS and plant-CAPEX defaults load as editable inputs.
- Set your own price, variable cost, fixed cost, capacity utilization, machinery CAPEX and working-capital days. Pick annual or quarterly periods and a 3 to 25-year horizon.
- Preview the linked statements, gross margin, IRR and DCF, then download the Excel workbook. Up to 3 years is free with just your email; longer horizons are a one-time purchase.
Three focused variants build on the same manufacturing engine: the manufacturing cash flow forecasting model for the inventory cash cycle, the manufacturing DCF valuation model for enterprise value and IRR, and the manufacturing free cash flow model for the CAPEX-to-FCF bridge and peak funding need.
Frequently asked questions
How is depreciation handled?
Primary and secondary CAPEX each carry their own useful life and start year, with a straight-line schedule feeding net book value on the balance sheet.
Can I model working capital?
Yes — a working-capital-days assumption drives the cash-conversion cycle across the cash flow and balance sheet.
What horizon suits a manufacturing plan?
Operating plans run 3–5 years (3-year model free); plant-investment appraisals often need 10–20 years, available with premium.
What is capacity utilization and why does it matter?
Capacity utilization is actual output divided by maximum sustainable output. Because a factory's costs are largely fixed, running at 85% instead of 65% spreads the same plant and overhead over far more units, so utilization is often the single biggest driver of manufacturing profit. US manufacturing runs around 76-78% on average, and the gap between that and full capacity is where operating leverage lives.
Why is manufacturing so sensitive to volume?
Operating leverage. A large share of a factory's cost, depreciation, maintenance, salaried staff, is fixed regardless of how many units it makes. Above break-even, most of each additional sale drops to profit; below it, losses mount quickly. That is why a 10% swing in volume can move manufacturing profit by 30% or more, and why the model separates fixed from variable cost explicitly.
How much working capital does a manufacturer need?
More than most businesses, because cash is tied up at three stages: raw materials, work in progress, and finished goods, plus trade receivables from B2B customers. A cash conversion cycle of 60-100 days is common, so growth funds a large and rising working-capital position. The model turns inventory and receivable days into the period cash movement so the funding need is visible.
Manufacturing across our four models
Manufacturing Cashflow Forecasting Model · Manufacturing DCF Valuation Model · Manufacturing Free Cashflow Model
More industry financial models
SaaS / Subscription financial model · Data Center financial model · Real Estate financial model · Hotel / Hospitality financial model · E-commerce / Retail financial model · Healthcare / Clinic financial model · Fintech / Lending financial model · Energy / Solar financial model · Early-Stage Startup financial model · Restaurant / F&B financial model · Professional Services financial model · Logistics / Transport financial model · Education / Training financial model · Construction financial model · Media / Content financial model · Telecom / ISP financial model · Agriculture financial model · Pharma / Distribution financial model · Fitness / Wellness financial model · Nonprofit / NGO financial model · Pricing
Free tools
WACC calculator · CAPM calculator · DCF calculator · IRR calculator · Inside the 16-sheet model · Glossary