Education Financial Model in Excel (Free School & EdTech Download)
An education financial model projects tuition revenue (students × fees) plus online-course income against faculty payroll, facility rent and curriculum costs, producing linked three-statement forecasts with valuation. Generate the full 16-sheet Excel model free for up to 3 years.
⚡ Generate my Education / Training model — free (requires JavaScript)
The fastest way to an investor-ready education / training financial model is a template pre-loaded with the industry's real revenue drivers and cost structure. This generator builds a 16-sheet, fully formula-linked Excel workbook — three statements, DCF & IRR — around education / training-specific assumptions in about five minutes. Free up to 3 years, just your email.
Key drivers pre-loaded in this template
| Students × fees | Enrollment-driven revenue |
| Online course stream | Scalable digital income, 35% growth default |
| Faculty payroll | Primary operating cost |
| WACC ~11% | Stable-demand sector discount rate |
What you get
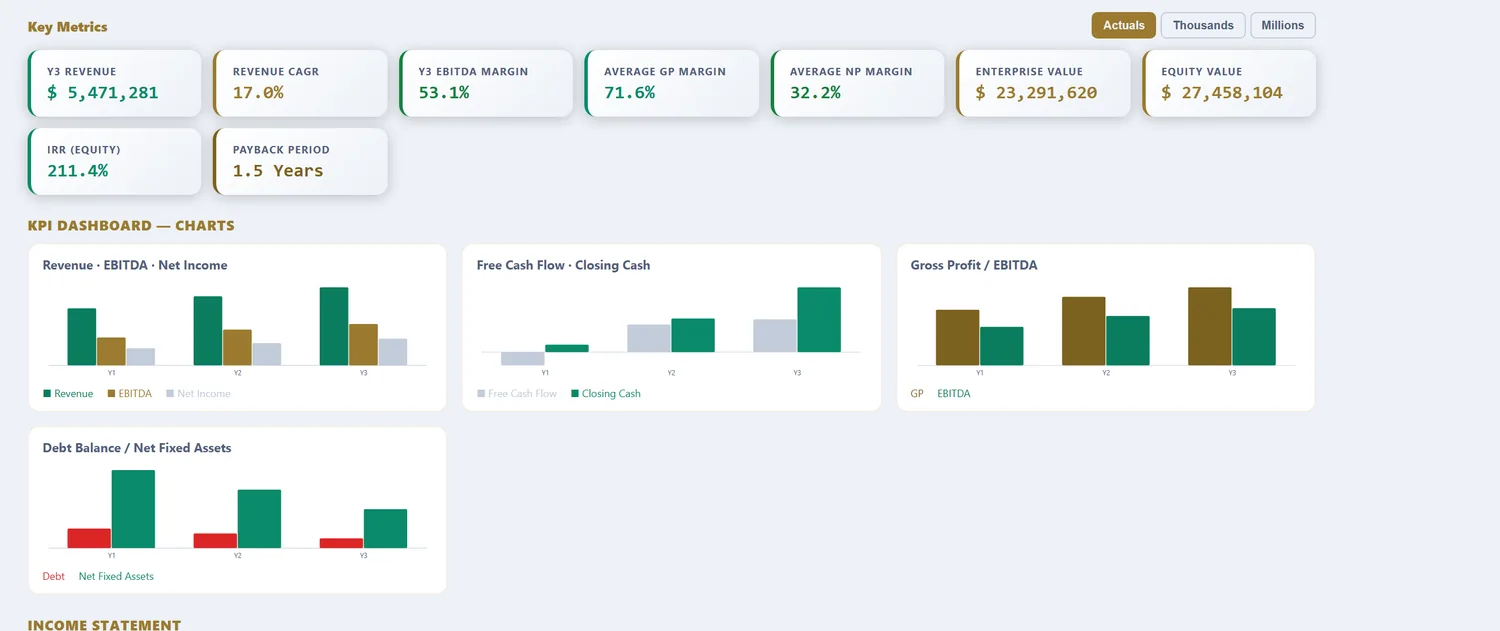
A 16-sheet, fully formula-linked Excel workbook: Assumptions, Revenue, OPEX, CAPEX & Depreciation, Debt, Tax (with loss carryforward), Income Statement, Cash Flow, Balance Sheet, DCF Valuation, Sensitivity tables, a charted KPI Dashboard, a Scenarios sheet (Base, Best & Worst), and an Integrity Check. Free 16-sheet linked Excel download for models up to 3 years (annual or quarterly, just your email). Models from 5 to 25 years are $29.98 per model download.
What an education financial model computes
An education business, whether a school, a training provider or an edtech platform, is a capacity business funded by tuition. Revenue is students multiplied by fees, plus course or ancillary income, and it grows through enrolment and, just as importantly, through retention. The cost base is dominated by teachers or instructors, which behave as a step cost hired by cohort, and by the facility or platform, which is largely fixed. The margin comes from filling that fixed capacity. A generic template treats tuition like ordinary revenue and misses the two things that decide an education business: retention compounding the base and utilization of a fixed cost.
The template loads education-scale defaults: tuition revenue from students and fees plus course income, teacher cost as the dominant line, and facilities or platform CAPEX on the schedule. What follows is what each part does with real education numbers in it.
Education types change the model
Before any numbers, the education type sets the cost structure and the scaling logic.
| Type | Revenue basis | Cost profile | Modelling focus |
|---|---|---|---|
| School / college | Students × annual tuition | Teachers + facilities, fixed | Enrolment, retention, capacity |
| Training provider | Courses × fee, cohorts | Instructors per cohort | Cohort fill, utilization |
| EdTech (subscription) | Users × subscription | Platform + acquisition | CAC, retention, near-zero marginal |
| EdTech (course sales) | Courses sold | Content + marketing | Conversion, completion, catalogue |
A school earns annual tuition against teachers and classrooms that are fixed once set, so enrolment and retention against capacity drive everything. A training provider runs cohorts, and filling each cohort against a fixed instructor cost is the margin. Subscription edtech has near-zero cost to serve one more user once built, so it lives on acquisition and retention like any software business. Course-sale edtech turns on conversion and catalogue depth. The model keeps the type explicit because scaling a classroom and scaling a platform are opposite problems.
Enrolment and retention: the compounding base
Education revenue is a base that has to be both grown and kept.
| Component | What it is | Sign |
|---|---|---|
| Opening enrolment | Students carried in | Base |
| + New enrolment | Students recruited | Add |
| − Attrition | Students who leave / graduate | Subtract |
| = Closing enrolment | Students carried out | Result |
| × Fee | Tuition per student | Revenue |
Net enrolment growth is new students minus attrition, and the attrition line is the one that quietly decides the trajectory, because every student lost has to be recruited again before the base even grows. Retention is cheaper than acquisition and compounds a stable base, which is why a school with strong retention can grow steadily while one with weak retention spends heavily just to stand still. The model separates enrolment, attrition and fee so a growth plan built on recruiting harder reads differently from one built on keeping the students already enrolled.
The four assumptions that decide education returns
| Assumption | Typical range | Why it dominates |
|---|---|---|
| Enrolment / capacity fill | Share of seats used | Spreads fixed teacher and facility cost |
| Retention | Higher is compounding | Cheaper than acquisition |
| Fee per student | Market-dependent | Revenue per enrolment |
| Teacher : student ratio | Quality vs cost trade | The dominant step cost |
Capacity fill spreads the fixed cost of teachers and classrooms, so a half-full cohort is the fastest way to lose money. Retention compounds the base and is far cheaper than recruiting. Fee sets revenue per student. And the teacher-to-student ratio is the central trade-off, because more teachers per student lifts quality and cost together, so the model treats it as an explicit lever rather than a fixed assumption. Get honest ranges on these four and the operating leverage falls out.
Worked example: a training provider, in numbers
| Input | Value |
|---|---|
| Students (year 1) | 1,200 |
| Average annual fee | $3,500 |
| Revenue | $4.2M |
| Retention | 85% |
| Teacher cost | 45% of revenue |
| Facilities & overhead | 30% of revenue |
| Capacity fill | 75% |
| Platform / fit-out CAPEX | $500,000 |
From enrolment to margin and IRR
1,200 students at a $3,500 average fee is $4.2M of tuition revenue. Teacher cost at 45% is the anchor, and after facilities and overhead the operating margin for an established provider lands in the mid-teens. The sensitivity is in fill and retention: lift capacity fill from 75% to 85% and revenue rises against a fixed teacher and facility base, dropping heavily to margin, while an eight-point retention gain reduces the acquisition spend needed to hold the base steady. Let retention slip and the provider runs harder just to stay level. Over a 3 to 25-year horizon the model carries the retention compounding, funds the periodic refresh of facilities or platform, and produces the DCF and IRR, where enrolment durability and capacity utilization decide whether the business scales or plateaus. For an edtech platform the same worked logic runs with different weights, near-zero marginal cost to serve one more student but heavy acquisition spend, so the model shifts the emphasis from classroom fill to CAC and completion while keeping the retention engine at the centre.
Term timing and the tuition cash cycle
Education revenue is earned steadily across a year but collected in lumps, and the timing shapes the cash forecast as much as the profit. Tuition is often paid at the start of a term or a year, so cash arrives ahead of the teaching it funds, which for an established school is a genuine benefit: it is partly financed by fees collected in advance, the deferred-revenue cushion a growing cohort provides. A new provider has the opposite problem, spending on teachers and facilities before the first term's fees land. Scholarships, instalment plans and bad debt on unpaid fees all soften the collection, and the model carries the term rhythm so the cash position through the year is visible rather than assumed even. For an edtech business the same logic applies to annual subscriptions billed in advance, which fund growth the way they do for any software business. The distinction matters for planning: an established school with fees in advance can weather a slow term, while a new provider with the same annual profit can run out of cash mid-year simply because the collection lands after the spending.
Education model vs a generic financial model
| What differs | Generic model | Education financial model |
|---|---|---|
| Revenue driver | Price × volume | Students × fee, enrolment net of attrition |
| Growth quality | Single rate | Enrolment and retention separated |
| Cost logic | Blended | Teachers as a step cost, fixed facilities |
| Margin driver | Growth | Capacity utilization and retention |
| CAPEX | Steady spend | Facilities or platform, periodic refresh |
Enrolment, tuition and completion benchmarks for grounding assumptions are published by the National Center for Education Statistics, the standard US reference for education data.
Reference: National Center for Education Statistics (NCES), the benchmark source for US enrolment, tuition and completion data.
How to download your education model (3 steps)
- Choose the Education / Training template. The students, fees, retention and teacher-cost defaults load as editable inputs.
- Set your own enrolment, fees, retention, teacher ratio and capacity. Pick annual or quarterly periods and a 3 to 25-year horizon.
- Preview the linked statements, margin and IRR, then download the Excel workbook. Up to 3 years is free with just your email; longer horizons are a one-time purchase.
Three focused variants build on the same education engine: the education cash flow forecasting model for term-fee timing, the education DCF valuation model for enterprise value and IRR, and the education free cash flow model for the cash bridge.
Frequently asked questions
Can I model enrollment growth?
Yes — drive tuition as units × price, with units as student count and price as annual fees.
Does it work for edtech startups?
Yes — use the online-course stream with high growth, or start from the SaaS template for pure subscription edtech.
What about a new campus?
Model campus build-out as initial CAPEX with debt; multi-decade appraisals use the premium tier.
Why does retention matter more than enrolment in an education model?
Because a retained student is far cheaper than a recruited one, and retention compounds. A school or course that keeps 90% of students year on year builds a stable base that new enrolment adds to, while one losing a third every year is running to stand still, refilling the base before it can grow. The model tracks retention as a primary driver so the true cost of churn, in lost tuition and repeated acquisition, is visible.
How is a school's cost structure different from edtech?
A physical school is facility-and-teacher heavy: classrooms are fixed cost, teachers are a step cost hired by cohort, so utilization of both drives margin. Edtech inverts it: near-zero marginal cost to serve one more student once the platform is built, but heavy upfront development and ongoing acquisition cost. The model handles both, because their economics, and where the risk sits, are opposite.
What drives margin in an education business?
Utilization of a largely fixed cost base. A classroom or a course platform costs much the same whether it serves 20 students or 40, so filling capacity is the fastest route to margin. Teacher or instructor cost is the largest line and behaves as a step cost, jumping with each cohort. The model separates the fixed capacity from the step costs so operating leverage shows up as enrolment grows.
Education across our four models
Education / Training Cashflow Forecasting Model · Education / Training DCF Valuation Model · Education / Training Free Cashflow Model
More industry financial models
SaaS / Subscription financial model · Data Center financial model · Real Estate financial model · Manufacturing financial model · Hotel / Hospitality financial model · E-commerce / Retail financial model · Healthcare / Clinic financial model · Fintech / Lending financial model · Energy / Solar financial model · Early-Stage Startup financial model · Restaurant / F&B financial model · Professional Services financial model · Logistics / Transport financial model · Construction financial model · Media / Content financial model · Telecom / ISP financial model · Agriculture financial model · Pharma / Distribution financial model · Fitness / Wellness financial model · Nonprofit / NGO financial model · Pricing
Free tools
WACC calculator · CAPM calculator · DCF calculator · IRR calculator · Inside the 16-sheet model · Glossary