Logistics Financial Model in Excel (Free Freight & Fleet Download)
A logistics or transport financial model projects freight revenue (shipments × rate) and warehousing income against fuel- and driver-heavy COGS around 62%, fleet CAPEX and vehicle financing, producing linked statements with DCF and IRR. Generate a 16-sheet Excel model free for up to 3 years.
⚡ Generate my Logistics / Transport model — free (requires JavaScript)
The fastest way to an investor-ready logistics / transport financial model is a template pre-loaded with the industry's real revenue drivers and cost structure. This generator builds a 16-sheet, fully formula-linked Excel workbook — three statements, DCF & IRR — around logistics / transport-specific assumptions in about five minutes. Free up to 3 years, just your email.
Key drivers pre-loaded in this template
| Shipments × rate | Volume-driven freight revenue |
| Warehousing stream | Storage and handling income |
| Fleet CAPEX $1.5M default | Vehicles with depreciation schedules |
| COGS ~62% | Fuel, drivers and maintenance |
What you get
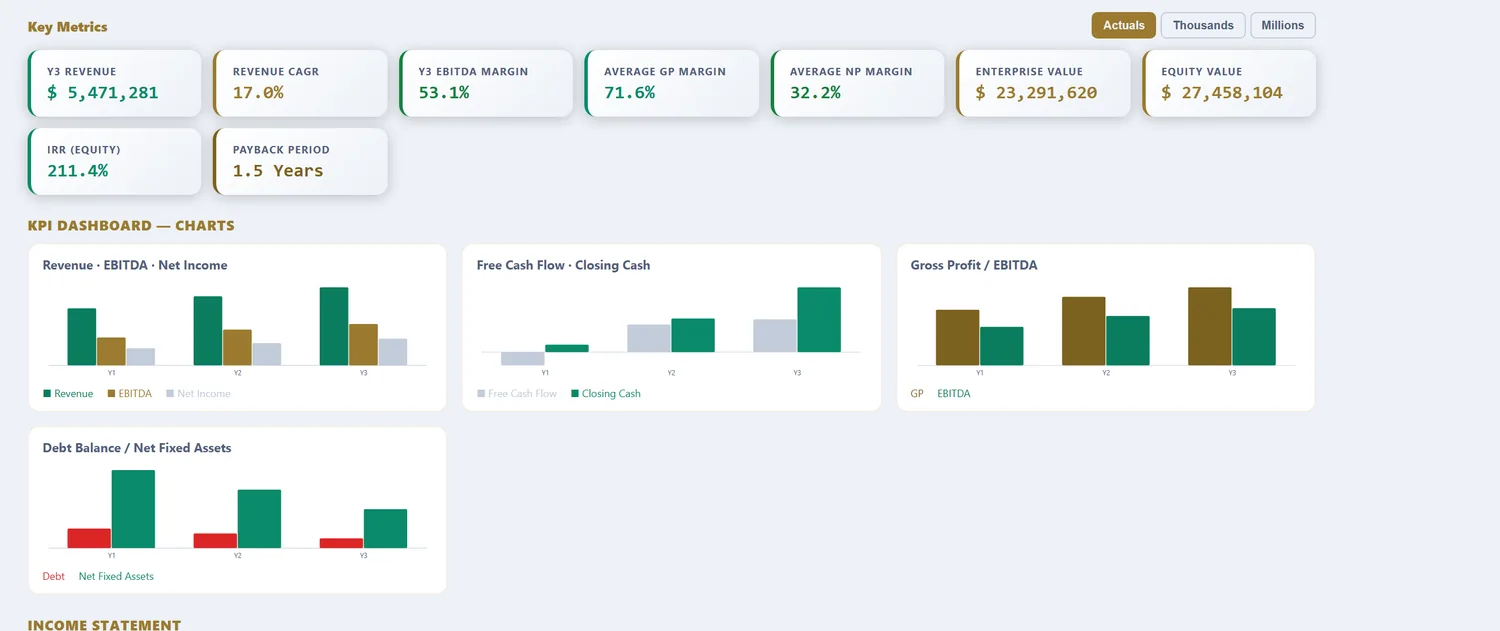
A 16-sheet, fully formula-linked Excel workbook: Assumptions, Revenue, OPEX, CAPEX & Depreciation, Debt, Tax (with loss carryforward), Income Statement, Cash Flow, Balance Sheet, DCF Valuation, Sensitivity tables, a charted KPI Dashboard, a Scenarios sheet (Base, Best & Worst), and an Integrity Check. Free 16-sheet linked Excel download for models up to 3 years (annual or quarterly, just your email). Models from 5 to 25 years are $29.98 per model download.
What a logistics financial model computes
Freight is a thin-margin, asset-heavy business where the difference between a good year and a bad one is a few points of cost, so the model has to track those points precisely. Revenue is loads or shipments multiplied by the rate, or for line-haul work, ton-miles multiplied by a rate per ton-mile. Against that sit the four costs that dominate transport: drivers, fuel, maintenance and the depreciation on the fleet itself. The single number that ties them together is the operating ratio, operating cost divided by revenue, and the whole model is really an exercise in keeping that ratio honest across a full economic cycle.
The template loads carrier-scale defaults: freight revenue driven by shipments and a rate, a fleet on the CAPEX schedule financed with equipment debt, and fuel and driver costs that move with volume. What follows is what each part does with real transport numbers in it.
Asset-based, asset-light, or hybrid
Before any numbers, the operating model decides the entire shape of the forecast. A carrier that owns its trucks looks nothing like a broker that arranges freight on other people's trucks.
| Model | How it earns | Assets | Modelling focus |
|---|---|---|---|
| Asset-based carrier | Owns fleet, hauls the freight | Heavy (tractors, trailers) | Utilization, cost per mile, fleet replacement |
| Asset-light broker | Margin on freight it does not carry | Minimal | Gross margin per load, working capital |
| Freight forwarder / 3PL | Orchestrates multi-modal shipments | Light to moderate | Take rate, service mix, receivables |
An asset-based carrier lives and dies on utilization and cost per mile, because the trucks depreciate whether or not they are loaded. A broker never touches the freight: it buys capacity at one price, sells it at another, and the model turns on the margin per load and the cash gap between paying the carrier and collecting from the shipper. A 3PL or forwarder sits between the two, earning a fee for organising ocean, air and road legs, where the service mix sets the effective take rate.
Freight modes and what each does to the model
Within asset-based trucking the mode changes the revenue and cost shape again, and a carrier running several needs each modelled on its own economics.
| Mode | Load basis | Rate & margin | Modelling note |
|---|---|---|---|
| Full truckload (FTL) | One shipper per trailer | Lower rate, simpler ops | Rate per mile, deadhead, lane density |
| Less-than-truckload (LTL) | Many shippers per trailer | Higher yield, terminal cost | Density, hub network, handling |
| Intermodal | Rail line-haul + drayage | Cheaper long-haul, slower | Rail cost, drayage, transit reliability |
| Last-mile / parcel | Many small drops | High cost per stop | Stops per route, failed-delivery rate |
Full truckload is the simplest: one shipper fills the trailer, the rate is lower per mile but the operation is clean, so lane density and empty miles decide the margin. Less-than-truckload consolidates many shippers into one trailer, which lifts yield but adds terminal handling and demands a hub network, so density is everything. Intermodal hands the long line-haul to rail and keeps only the drayage at each end, cheaper over distance but slower and dependent on rail reliability. Last-mile is the most expensive per unit because the cost is the stop, not the mile, and a failed delivery doubles it. The model keeps modes as separate streams so a mixed fleet reads honestly rather than hiding a loss-making lane inside a blended average.
The cost structure that decides the operating ratio
Four lines carry most of a carrier's cost, and each behaves differently as volume changes.
| Cost line | Share of revenue | Behaviour |
|---|---|---|
| Driver wages & benefits | 30-40% | Largest line; scales with miles, tightens in driver shortages |
| Fuel | 20-25% | Volatile; often passed through via a fuel surcharge |
| Maintenance & tyres | 8-12% | Rises with fleet age; the case for replacement CAPEX |
| Equipment depreciation / lease | 10-15% | Fixed to the fleet, not the miles |
Driver pay is the biggest and the most exposed to labour markets. Fuel is the most volatile, which is why carriers negotiate a fuel surcharge that passes swings through to the shipper, and the model keeps the surcharge as a separate line so the pass-through is visible. Maintenance climbs as the fleet ages, which is exactly what justifies replacing tractors on a schedule rather than running them into the ground. Depreciation is fixed to the fleet regardless of how many miles it turns, so an idle truck is pure cost.
The four assumptions that decide logistics returns
A transport model has many inputs, but the answer is set by a handful. Get these right and the operating ratio falls out honestly.
| Assumption | Typical range | Why it dominates |
|---|---|---|
| Rate per mile / per load | $1.80-2.50/mi (US van) | Sets revenue on a near-fixed cost base |
| Empty (deadhead) miles | 10-20% of total | Miles run for no revenue, straight margin loss |
| Fuel price & surcharge recovery | Varies; 90-100% recovery | The gap between the two hits the operating ratio |
| Fleet utilization | Revenue miles ÷ available | Spreads fixed truck cost over more paid miles |
Rate per mile sets revenue against a cost base that barely moves, so a small rate change is almost pure profit or pure loss. Deadhead miles, the empty repositioning between a drop-off and the next pickup, are the quiet killer: at 20% empty, one mile in five earns nothing while still burning fuel and wages. Fuel surcharge recovery matters because a carrier recovering only 90% of a fuel spike absorbs the other 10% directly into the operating ratio. Utilization spreads the fixed cost of the truck: the same tractor turning more paid miles carries its depreciation more easily.
Worked example: a 50-truck carrier, in numbers
| Input | Value |
|---|---|
| Fleet | 50 tractors |
| Revenue miles per truck / yr | 110,000 |
| Rate per mile | $2.10 |
| Annual revenue | ~$11.6M |
| Driver cost | 35% of revenue |
| Fuel (net of surcharge) | 20% of revenue |
| Maintenance | 10% of revenue |
| Tractor CAPEX | $150,000 each, 5-yr life |
| Equipment debt | 70% of fleet at 8% |
From miles to operating ratio and IRR
Fifty trucks at 110,000 revenue miles each is 5.5 million paid miles, and at $2.10 a mile that is roughly $11.6M of revenue. Driver, fuel and maintenance together run about 65% of revenue, and once depreciation, insurance and overhead are added the operating ratio lands near 93%, leaving an operating margin around 7%. That is normal for asset-based trucking, and it is why the equity return depends so heavily on financing the fleet efficiently and keeping the trucks loaded. After debt service on the equipment loans, the levered return to equity for a well-run carrier sits in the low-to-mid teens over the fleet cycle. Push utilization up a few points or trim deadhead miles and that same operation moves materially, which is why the sensitivity tables matter here.
Working capital: the freight cash gap
A carrier pays drivers and fuel now but collects from shippers in 30 to 45 days, so growth consumes cash even when every load is profitable. That gap is why freight factoring is common and why the working-capital line deserves attention: faster growth widens the receivable faster than profit funds it. The model turns receivable days into the period cash movement so you can see the funding need before it arrives, rather than discovering it when payroll is due.
Logistics model vs a generic financial model
| What differs | Generic model | Logistics financial model |
|---|---|---|
| Revenue driver | Price × volume | Shipments × rate, or ton-miles × rate per ton-mile |
| Cost focus | Blended margin | Driver, fuel, maintenance tracked to the operating ratio |
| CAPEX shape | Steady annual spend | Fleet purchases on a replacement cycle |
| Fuel | Fixed cost line | Volatile, with a surcharge pass-through |
| Valuation | Single DCF | DCF plus EV/EBITDA, split asset-based vs asset-light |
Long-run rate and cost benchmarks worth grounding assumptions against are published by the US Bureau of Transportation Statistics, the standard reference for freight volumes, cost indices and modal data.
Reference: US Bureau of Transportation Statistics, the benchmark series for freight volumes, transport cost indices and modal data.
How to download your logistics model (3 steps)
- Choose the Logistics / Transport template. The freight revenue, fleet CAPEX and cost defaults load as editable inputs.
- Set your own rate per mile, miles per truck, driver and fuel shares, fleet size and equipment debt terms. Pick annual or quarterly periods and a 3 to 25-year horizon.
- Preview the linked statements, operating ratio, IRR and DCF, then download the Excel workbook. Up to 3 years is free with just your email; longer horizons are a one-time purchase.
Three focused variants build on the same logistics engine: the logistics cash flow forecasting model for the freight cash gap, the logistics DCF valuation model for enterprise value and IRR, and the logistics free cash flow model for the CAPEX-to-FCF bridge and peak funding need.
Frequently asked questions
How is fleet replacement handled?
Maintenance CAPEX (a % of initial CAPEX) recurs annually alongside the depreciation schedule.
Can I model vehicle financing?
Yes — the debt module supports term loans and lease financing with full repayment schedules.
What horizon suits fleet investment?
Operating plans run 3–5 years free; fleet and warehouse investments are often appraised over 7–15 years with premium.
What is a good operating ratio for a trucking company?
The operating ratio is operating cost divided by revenue, and lower is better. Most asset-based carriers run 92-96%; a sustained sub-90% ratio is strong and usually reflects dense lanes, low empty miles and disciplined cost control. Because margins are thin, a two-point move in the operating ratio can change net profit by a third or more.
Should I model an asset-based carrier or an asset-light broker?
They are different businesses. An asset-based carrier owns tractors and trailers, so the model is heavy on fleet CAPEX, depreciation and utilization. An asset-light broker or forwarder earns a margin on freight it does not carry, so the model is light on assets and turns on gross margin per load and working capital. The template runs both.
How do you value a logistics business?
Asset-based carriers typically trade at 5-7x EBITDA because the earnings come with heavy capital needs; asset-light brokers and forwarders command 10-15x because they convert more profit to free cash flow. The model builds both the DCF and an EV/EBITDA cross-check so the two views can be read side by side.
Logistics across our four models
Logistics / Transport Cashflow Forecasting Model · Logistics / Transport DCF Valuation Model · Logistics / Transport Free Cashflow Model
More industry financial models
SaaS / Subscription financial model · Data Center financial model · Real Estate financial model · Manufacturing financial model · Hotel / Hospitality financial model · E-commerce / Retail financial model · Healthcare / Clinic financial model · Fintech / Lending financial model · Energy / Solar financial model · Early-Stage Startup financial model · Restaurant / F&B financial model · Professional Services financial model · Education / Training financial model · Construction financial model · Media / Content financial model · Telecom / ISP financial model · Agriculture financial model · Pharma / Distribution financial model · Fitness / Wellness financial model · Nonprofit / NGO financial model · Pricing
Free tools
WACC calculator · CAPM calculator · DCF calculator · IRR calculator · Inside the 16-sheet model · Glossary