Data Center Financial Model in Excel (Free Colocation & MW Download)
A data center financial model projects revenue from MW capacity × utilization and colocation/power pricing against heavy upfront CAPEX, debt service and long depreciation lives. Because data centers are 15–25 year assets, long-horizon DCF matters — generate a linked 16-sheet Excel model here, free up to 3 years.
⚡ Generate my Data Center model — free (requires JavaScript)
The fastest way to an investor-ready data center financial model is a template pre-loaded with the industry's real revenue drivers and cost structure. This generator builds a 16-sheet, fully formula-linked Excel workbook — three statements, DCF & IRR — around data center-specific assumptions in about five minutes. Free up to 3 years, just your email.
Key drivers pre-loaded in this template
| MW × utilization % | Capacity-driven revenue build |
| Colocation + power & cross-connect | Two default revenue streams |
| High CAPEX & debt | $5M default initial CAPEX, $4M term debt |
| WACC ~11%, EV/EBITDA ~12x | Infrastructure-grade valuation defaults |
What you get
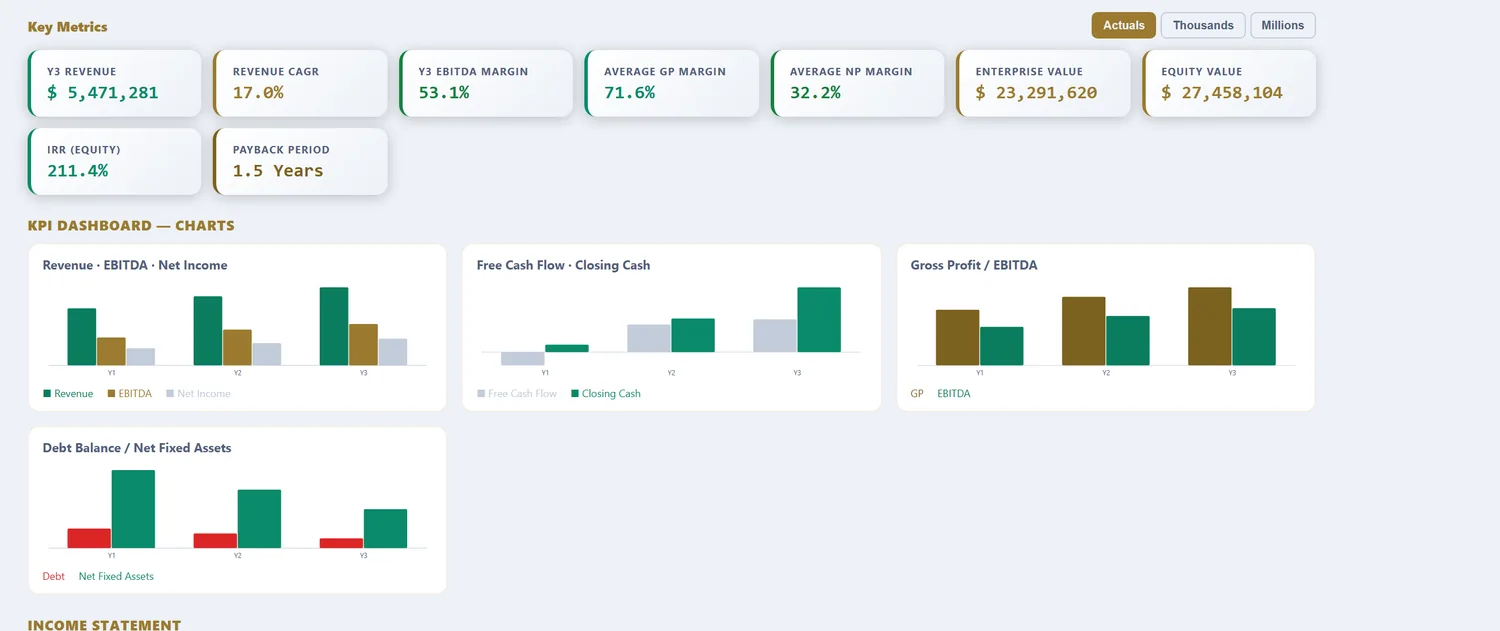
A 16-sheet, fully formula-linked Excel workbook: Assumptions, Revenue, OPEX, CAPEX & Depreciation, Debt, Tax (with loss carryforward), Income Statement, Cash Flow, Balance Sheet, DCF Valuation, Sensitivity tables, a charted KPI Dashboard, a Scenarios sheet (Base, Best & Worst), and an Integrity Check. Free 16-sheet linked Excel download for models up to 3 years (annual or quarterly, just your email). Models from 5 to 25 years are $29.98 per model download.
What a data center financial model computes
A data center is an infrastructure business that sells power and space to computing, and the model exists to show whether the capacity fills fast enough to earn back an enormous build. Revenue is IT capacity in megawatts multiplied by the share leased multiplied by the price, often with power billed through on top. The dominant costs are power, shaped by the facility's efficiency, and the depreciation of the build itself. The two forces that decide the return are lease-up and utilization on the revenue side, and PUE-driven power cost on the operating side. A generic template treats a data center like a normal business and misses the capital intensity, the power economics and the long lease structure that define it.
The template loads facility-scale defaults: revenue from MW capacity, utilization and price, a very large build on the CAPEX schedule with long-lived depreciation, and power as the dominant operating cost. What follows is what each part does with real data center numbers in it.
Facility types change the model
Before any numbers, the facility type sets the customer, the lease and the capital profile.
| Type | Customer | Lease | Modelling focus |
|---|---|---|---|
| Hyperscale | One or few cloud giants | Very long, large blocks | Pre-lease, low PUE, build cost |
| Colocation (retail) | Many smaller tenants | Shorter, per-rack | Occupancy, churn, price per rack |
| Wholesale | Enterprises by the MW | Long, by capacity | MW leased, lease-up pace |
| Edge | Distributed, latency-driven | Varied | Site count, utilization |
A hyperscale facility is often pre-leased to a single cloud giant before it is built, so the risk is execution and efficiency rather than lease-up, and PUE is fought over hard. Colocation rents racks to many tenants, so occupancy, churn and price per rack drive it like a property business. Wholesale leases whole megawatts to enterprises on long terms, so the lease-up pace of the capacity is everything. Edge distributes small facilities for latency, turning on site count and utilization. The model keeps the type explicit because the customer and the lease reshape the whole risk profile.
Power, PUE and the cost of running IT
Power is the defining operating cost of a data center, and PUE is the multiplier on it.
| Metric | Meaning | Effect |
|---|---|---|
| IT load | Power to the servers | The billable capacity |
| PUE | Total ÷ IT power | 1.1 efficient, 1.5+ legacy |
| Facility power | IT × PUE | The actual energy bill |
| Power recovery | Billed to tenants | Passes cost through, or not |
Every watt delivered to a server drags additional watts for cooling and distribution, and PUE captures that overhead. At a PUE of 1.5, a facility spends 50% more power than the IT alone; at 1.1, only 10%, which at hyperscale is a decisive cost advantage. Whether that power is reimbursed by tenants or absorbed by the operator decides how much of the energy bill hits margin, and the model keeps power recovery explicit so the pass-through, or its absence, is visible rather than buried.
The four assumptions that decide data center returns
| Assumption | Typical range | Why it dominates |
|---|---|---|
| Lease-up / utilization | Ramp to stabilised fill | Fills a vast fixed cost |
| Price per MW / rack | Market-dependent | Revenue on committed capital |
| PUE | 1.1-1.6 | Sets the power cost hitting margin |
| Build CAPEX per MW | Large, front-loaded | The capital to be earned back |
Lease-up is the master variable, because a facility earns nothing on capacity nobody has taken, and the ramp from construction to stabilised occupancy is where data center returns are won or lost. Price per MW sets revenue on the committed capital. PUE decides how much of the power bill reaches margin. And build CAPEX per MW is the capital the whole plan has to earn back over a long life. The model runs all four so a build is judged on the capacity it eventually leases, not the megawatts it can theoretically provide.
Worked example: a 20 MW facility, in numbers
| Input | Value |
|---|---|
| IT capacity | 20 MW |
| Stabilised utilization | 85% |
| Price per MW / yr | $1.4M |
| Stabilised revenue | ~$23.8M |
| PUE | 1.3 |
| Power recovery | mostly passed through |
| Build CAPEX | very heavy, front-loaded |
| Depreciation | long-lived assets |
| Lease-up | ramps over years |
From megawatts to margin and IRR
20 MW at 85% utilization and $1.4M per MW is roughly $23.8M of stabilised annual revenue, but the facility consumed an enormous build first, and depreciation on that build is one of the largest costs below the operating line. Power at a 1.3 PUE is the dominant operating cost, largely passed through to tenants in this example, so margin turns on how full the facility runs and how efficiently it uses power. The return depends entirely on the lease-up ramp: the same 20 MW earning at 50% occupancy in year two versus 85% at stabilisation is the difference between a struggling asset and a strong one, because the fixed cost is already sunk. Improve PUE toward 1.2 and more of the power cost is saved rather than spent. Over a 3 to 25-year horizon the model funds the build, runs the long depreciation, and produces the DCF and IRR, where lease-up pace and power efficiency push the value into the out-years the capacity has to fill.
Power sourcing and the long game
A data center's economics increasingly turn on power as much as on IT, because at this scale energy is both the largest cost and, more and more, a constraint on where and whether a facility can be built. Securing power, ideally cheap and low-carbon, under long contracts is now a strategic decision that shapes the whole model, since a facility with a favourable long-term power deal carries a structural margin advantage its rivals cannot match. Renewable power purchase agreements and on-site generation change the cost curve and the sustainability story that hyperscale tenants demand. The model keeps power price and recovery explicit precisely because a swing in energy cost, or a smart long-term contract, can move the return more than a change in lease price, and because the availability of power is fast becoming the real limit on capacity growth.
Data center model vs a generic financial model
| What differs | Generic model | Data center financial model |
|---|---|---|
| Revenue driver | Price × volume | MW × utilization × price, long leases |
| Main cost | Blended | Power, shaped by PUE, plus depreciation |
| CAPEX | Steady spend | Enormous, front-loaded build per MW |
| Fill | Assumed | Multi-year lease-up ramp |
| Where value sits | Near-term | Long-life assets, out-year occupancy |
Capacity, power and efficiency benchmarks for grounding assumptions are tracked by the US Department of Energy and the Uptime Institute; the DOE's data center energy research is the standard public reference for facility power and efficiency.
Reference: US Department of Energy — Data Centers & Servers, the benchmark reference for facility power and efficiency.
How to download your data center model (3 steps)
- Choose the Data Center template. The MW capacity, utilization, price and power defaults load as editable inputs.
- Set your own capacity, lease-up, price per MW, PUE, power recovery and build CAPEX. Pick annual or quarterly periods and a 3 to 25-year horizon.
- Preview the linked statements, margin, IRR and DCF, then download the Excel workbook. Up to 3 years is free with just your email; longer horizons are a one-time purchase.
Three focused variants build on the same data center engine: the data center cash flow forecasting model for the build-and-lease-up cash gap, the data center DCF valuation model for enterprise value and IRR, and the data center free cash flow model for the CAPEX-to-FCF bridge and peak funding need.
Frequently asked questions
Why do data center models need 15–25 year horizons?
Data centers are long-lived infrastructure with payback often beyond 10 years; lenders and investors expect a full asset-life DCF, which the premium 25-year tier supports.
What discount rate is typical for data centers?
Stabilized data centers are often valued around a 9–12% WACC; the template defaults to 11% and lets you build WACC via CAPM.
Does the model handle debt service?
Yes — principal, interest rate, tenor and grace period feed a full debt schedule with coverage ratios.
What is PUE and why does it matter in a data center model?
Power usage effectiveness is total facility power divided by the power actually delivered to IT equipment. A PUE of 1.5 means half as much energy again is spent on cooling and overhead as on the servers themselves; a hyperscale facility at 1.1 wastes far less. Because power is the largest operating cost, PUE flows straight to margin, and the model keeps it explicit so an efficiency gain shows up as profit.
How is data center revenue actually earned?
By selling IT capacity, usually priced per megawatt or per kilowatt of power delivered, or per rack in a colocation model, under long leases. Revenue is capacity multiplied by the share leased multiplied by the price, plus power reimbursement. Because the facility is enormously expensive to build, the whole return depends on filling that capacity, so lease-up pace and utilization are the numbers that decide the model.
Why are data centers so capital-intensive?
Because the shell, power infrastructure and cooling have to be built before a single customer is served, and at scale that runs into hundreds of millions. The capital is front-loaded and depreciates over long asset lives, so returns depend entirely on leasing the capacity that capital created. It is an infrastructure business: heavy build, long leases, and a return earned slowly as the facility fills.
Data Center across our four models
Data Center Cashflow Forecasting Model · Data Center DCF Valuation Model · Data Center Free Cashflow Model
More industry financial models
SaaS / Subscription financial model · Real Estate financial model · Manufacturing financial model · Hotel / Hospitality financial model · E-commerce / Retail financial model · Healthcare / Clinic financial model · Fintech / Lending financial model · Energy / Solar financial model · Early-Stage Startup financial model · Restaurant / F&B financial model · Professional Services financial model · Logistics / Transport financial model · Education / Training financial model · Construction financial model · Media / Content financial model · Telecom / ISP financial model · Agriculture financial model · Pharma / Distribution financial model · Fitness / Wellness financial model · Nonprofit / NGO financial model · Pricing
Free tools
WACC calculator · CAPM calculator · DCF calculator · IRR calculator · Inside the 16-sheet model · Glossary