SaaS Financial Model in Excel (Free MRR, Churn & CAC Download)
A SaaS financial model projects recurring revenue using MRR growth and churn, layered with customer-acquisition cost, hosting COGS and payroll to produce linked three-statement forecasts and a DCF valuation. Generate one free as a 16-sheet Excel workbook — up to 3 years free, or 25 years with premium.
⚡ Generate my SaaS / Subscription model — free (requires JavaScript)
The fastest way to an investor-ready saas / subscription financial model is a template pre-loaded with the industry's real revenue drivers and cost structure. This generator builds a 16-sheet, fully formula-linked Excel workbook — three statements, DCF & IRR — around saas / subscription-specific assumptions in about five minutes. Free up to 3 years, just your email.
Key drivers pre-loaded in this template
| MRR growth & churn | Net recurring revenue expansion, the core SaaS driver |
| Gross margin ~80% | Hosting and support COGS around 20% of revenue |
| CAC & marketing spend | Modelled as a percentage of revenue with inflation |
| EV/EBITDA ~10x, WACC ~13% | Default valuation assumptions, fully editable |
What you get
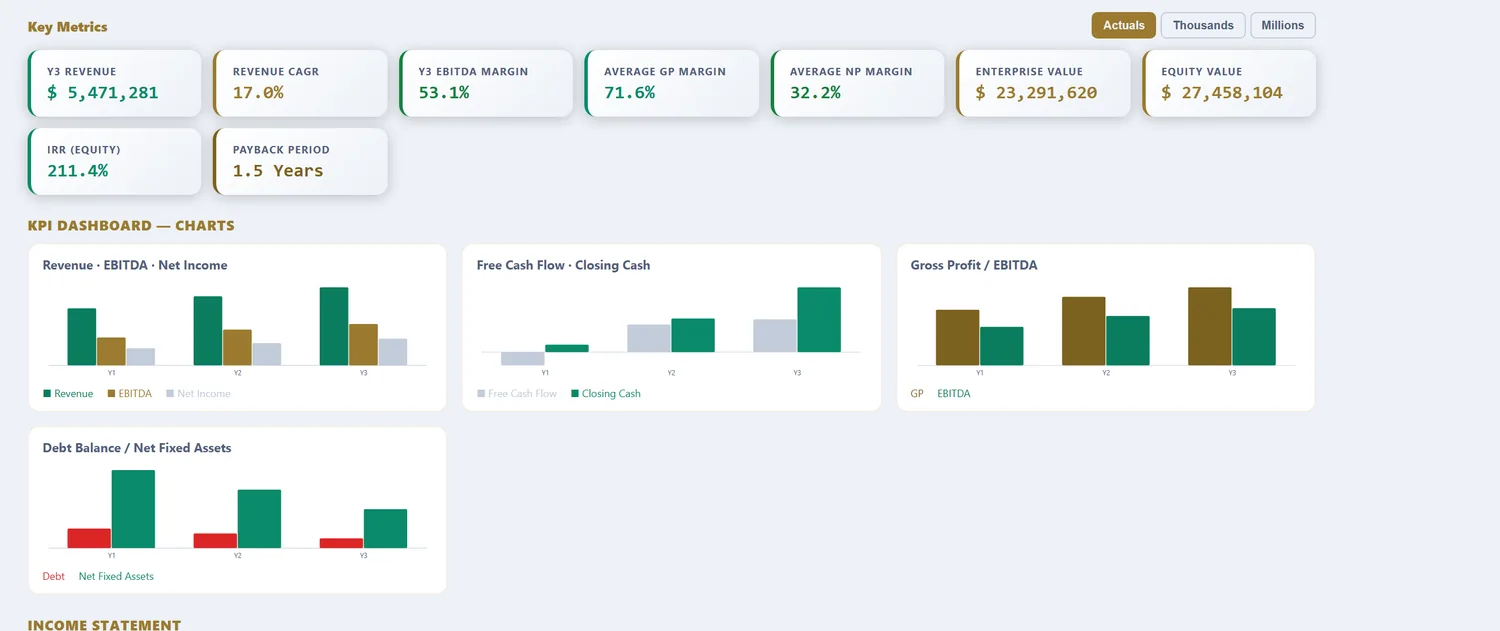
A 16-sheet, fully formula-linked Excel workbook: Assumptions, Revenue, OPEX, CAPEX & Depreciation, Debt, Tax (with loss carryforward), Income Statement, Cash Flow, Balance Sheet, DCF Valuation, Sensitivity tables, a charted KPI Dashboard, a Scenarios sheet (Base, Best & Worst), and an Integrity Check. Free 16-sheet linked Excel download for models up to 3 years (annual or quarterly, just your email). Models from 5 to 25 years are $29.98 per model download.
What a SaaS financial model computes
Subscription software is a compounding-revenue business, and the model is built to show whether that compounding is healthy or hollow. Revenue is not a single line but a build: opening recurring revenue, plus new bookings, plus expansion from existing customers, minus churn. Around it sit the two ratios that decide whether growth is worth funding, customer acquisition cost against lifetime value, and the payback period between them. SaaS has unusually kind economics, gross margins near 80% and often negative working capital, but those same features let a bad plan hide behind a good growth rate, which is why the model surfaces retention and efficiency rather than just topline.
The template loads SaaS-scale defaults: an MRR-driven revenue build with churn, acquisition cost as the growth engine, high gross margin, and the deferred-revenue cash benefit of annual billing. What follows is what each part does with real SaaS numbers in it.
The recurring-revenue build
SaaS revenue is a flow, not a stock, and modelling it as a simple growth rate misses where the value leaks or compounds.
| Component | What it is | Sign |
|---|---|---|
| Opening MRR | Recurring revenue carried in | Base |
| + New MRR | New customers won | Add |
| + Expansion MRR | Upsell / seats added to existing base | Add |
| − Churned MRR | Cancellations and downgrades | Subtract |
| = Closing MRR | Recurring revenue carried out | Result |
Two businesses can show the same net growth while being completely different: one wins many customers and loses many, the other wins few and keeps almost all. The waterfall exposes that. Expansion revenue is the quiet compounder, because selling more to a happy customer costs a fraction of winning a new one, and it is what pushes net revenue retention above 100%. Churn is the tax on all of it, and because it compounds against the base, a couple of points of monthly churn is the difference between a durable business and a treadmill.
Unit economics: CAC, LTV and payback
The central question in SaaS finance is whether a dollar of acquisition spend comes back and how fast. Three numbers answer it.
| Metric | What it measures | Healthy |
|---|---|---|
| LTV / CAC | Lifetime value vs cost to acquire | 3x or better |
| CAC payback | Months of gross margin to recover CAC | Under 12-18 months |
| Net revenue retention | Cohort revenue a year on | 100%+, 120%+ is strong |
Customer acquisition cost is paid in full the moment you win a customer; the revenue arrives over years of subscription. That timing is why an accrual profit-and-loss makes an efficient SaaS business look loss-making during a growth push, and why the model leans on payback and retention instead. If lifetime value clears acquisition cost by three times and payback lands inside a year and a half, aggressive spend is an investment; if not, growth is just buying revenue at a loss.
The four assumptions that decide SaaS returns
| Assumption | Typical range | Why it dominates |
|---|---|---|
| Churn / net revenue retention | NRR 100-125% | Compounds for or against the base |
| CAC & payback | Under 12-18 mo payback | The largest discretionary spend |
| Gross margin | 75-85% | Sets cash conversion of every dollar |
| Growth rate vs burn | Rule of 40 | The trade-off investors price |
Retention is the compounder: at 120% net retention the business grows a fifth a year before a single new sale, while below 100% it shrinks unless sales keep sprinting. Acquisition cost and payback set how efficiently growth is bought. Gross margin, high in SaaS, means most of each new dollar of revenue converts to cash once acquisition normalises. And the balance of growth against burn, captured by the Rule of 40, is the trade-off the market actually prices, because growth funded by unlimited losses is worth far less than growth that pays for itself.
Worked example: a growing SaaS business, in numbers
| Input | Value |
|---|---|
| Starting ARR | $3.0M |
| New ARR growth | 50% year 1, tapering |
| Gross churn | 10% per year |
| Net revenue retention | 115% |
| Gross margin | 80% |
| CAC payback | 14 months |
| Sales & marketing | 40% of revenue (growth phase) |
| Billing | Annual, in advance |
From MRR to margin and IRR
A $3.0M ARR business at 115% net retention already grows 15% from its existing base before new sales, and adding new bookings pushes total growth well above that early on. At an 80% gross margin the revenue converts efficiently, but sales and marketing at 40% of revenue keeps operating profit thin or negative during the growth phase, which is the point: the free cash flow line stays soft while the recurring base compounds underneath it. Annual billing softens the cash impact, because customers pay a year ahead and fund part of the growth. The DCF is where SaaS value really sits, because most of the worth is in the durable out-years the retention protects, so the discount rate and the churn assumption matter more here than in almost any other model. Hold retention flat and the valuation is ordinary; let it compound and the same business looks transformative, which is exactly what the sensitivity tables are for.
Burn, runway and the path to profitability
Because SaaS spends ahead of the revenue it is building, the model has to answer a blunt question alongside the growth story: how long does the cash last. Burn is the monthly net cash outflow during the growth phase, and runway is the cash balance divided by that burn, the number of months before the business needs more money or has to reach profitability. The two move together with the growth plan: spending harder on acquisition buys faster growth but shortens runway, and the right balance depends on how efficient that spend is, which loops straight back to payback and net retention. A business with strong unit economics can burn confidently because each cohort pays back and compounds; one with weak retention is burning into a leaky bucket and should slow down. The model tracks closing cash and runway each period so a growth plan can be judged against the funding it actually requires, not just the growth it promises, and the cash flow variant takes that runway view further.
SaaS model vs a generic financial model
| What differs | Generic model | SaaS financial model |
|---|---|---|
| Revenue | Price × volume | MRR waterfall: new + expansion − churn |
| Growth quality | Single growth rate | Net revenue retention and churn split out |
| Growth cost | Marketing % | CAC judged on payback and LTV |
| Working capital | Positive drain | Negative: deferred revenue funds growth |
| Where value sits | Near-term profit | Durable out-years, retention-protected |
For grounding retention, churn and margin assumptions against real companies, public SaaS businesses disclose these metrics in their filings, readable through the SEC's EDGAR database, the primary source for audited SaaS unit economics.
Reference: SEC EDGAR full-text search, where listed SaaS companies disclose net revenue retention, churn and CAC in audited filings.
How to download your SaaS model (3 steps)
- Choose the SaaS / Subscription template. The MRR, churn, CAC and margin defaults load as editable inputs.
- Set your own starting ARR, growth, churn or net retention, gross margin and acquisition spend. Pick annual or quarterly periods and a 3 to 25-year horizon.
- Preview the linked statements, Rule of 40, IRR and DCF, then download the Excel workbook. Up to 3 years is free with just your email; longer horizons are a one-time purchase.
Three focused variants build on the same SaaS engine: the SaaS cash flow forecasting model for burn and runway, the SaaS DCF valuation model for enterprise value and IRR, and the SaaS free cash flow model for the FCF bridge and cash conversion.
Frequently asked questions
How many years should a SaaS financial model cover?
Most SaaS models cover 3–5 years, which the free tier fully supports. Later-stage or PE-backed SaaS plans may extend to 7–10 years using the premium tier.
What metrics matter most in a SaaS model?
MRR growth, gross and net churn, gross margin, CAC payback and the resulting free cash flow. Our template pre-loads realistic defaults for each.
Is the SaaS template really free?
Yes — build, preview and download the full 16-sheet Excel free for up to 3 years, with no account needed.
What is net revenue retention and why does it matter?
Net revenue retention (NRR) measures how much recurring revenue an existing cohort produces a year later, after churn and after expansion. Above 100% means the base grows even with zero new customers, because upsells outweigh cancellations, and it is the single strongest signal of durable SaaS growth. Best-in-class sits at 120%+; below 100% the business has a leaky bucket that new sales must keep refilling.
What is the Rule of 40 for SaaS?
The Rule of 40 says a healthy SaaS business should have its revenue growth rate plus its profit margin sum to at least 40%. A company growing 60% while burning 20% passes; so does one growing 15% at 25% margin. It is a shorthand for the growth-versus-profitability trade-off, and the model computes it each year so you can see whether a plan clears the bar or leans too hard on one side.
Why does SaaS have negative working capital?
Because many SaaS contracts are billed annually in advance. The customer pays for twelve months up front, which the business collects as cash now and recognises as revenue over the year. That deferred revenue is a cash source, so a growing SaaS company is often funded partly by its own customers, the opposite of an inventory business. The model captures it so cash generation reads ahead of accounting profit.
SaaS across our four models
SaaS / Subscription Cashflow Forecasting Model · SaaS / Subscription DCF Valuation Model · SaaS / Subscription Free Cashflow Model
More industry financial models
Data Center financial model · Real Estate financial model · Manufacturing financial model · Hotel / Hospitality financial model · E-commerce / Retail financial model · Healthcare / Clinic financial model · Fintech / Lending financial model · Energy / Solar financial model · Early-Stage Startup financial model · Restaurant / F&B financial model · Professional Services financial model · Logistics / Transport financial model · Education / Training financial model · Construction financial model · Media / Content financial model · Telecom / ISP financial model · Agriculture financial model · Pharma / Distribution financial model · Fitness / Wellness financial model · Nonprofit / NGO financial model · Pricing
Free tools
WACC calculator · CAPM calculator · DCF calculator · IRR calculator · Inside the 16-sheet model · Glossary